(GRCS stands for Governance, Risk, Compliance and Security)
A well-panned GRC strategy affords a company many benefits: fast and effective decision making, improved and targeted IT investments and better cooperation among divisions. It is increasingly important that the companies effectively manage and leverage on risks to grow while adhering to rapidly changing compliance environments. However, Japanese companies lag behind global counterparts in GRC.
Therefore, GRCS, as a company, was created to remedy this and I am writing about them!
Who is GRCS?
GRCS (GRCS or the company) is a provider of Solutions and Products in GRC and Security Fields.
The company classifies its business into two segments: the solution and the product.
1. Solution Segment (95% of sales)
1) GRC Solution
The company analyzes the overall conditions of a client’s operating framework and visualizes the potential problems. Then it introduces cross-departmental solutions using their own and/or 3rd party products. GRCS also monitors the products and security flows to ensure the products and procedures installed are working in accordance with the initial plans.
In addition, the company also has introduced Supplier Risk MT, a cloud application developed by the company that provides centralized control of security risks related to external contractors and business partners.
2) Security Solution
In the cybersecurity field, the company provides IT security designs, establishes policies, and conducts analysis, management, audit, diagnosis and various other consultations to protect companies from risks such as cyberattacks, information leakage and security accidents. In addition, it also supports acquisition of standard certifications such as ISMS certification.
2. Product Segment (5% of sales)-All products are sold on monthly subscription
In the GRC field, the company provides dedicated tools for risk management, regulation/policy management, internal audits, incident management and personal information management.
The company’s main product in solution group is:
The company’s ERM tool “ERMT (Enterprise Risk MT)” evaluates risks for the entire organization, assists clients in visualizing and minimizing risks, allocating resources in an optimal way. By not leaving risks undetected, ERMT helps risks being dealt with before becoming too serious. ERMT is a Salesforce-based cloud and subscription based product.
The other products are:
CSIRT MT – analyzes cyber related risks.
OneTrust (3rd party product) – personal data management, including in compliance with GDPR (general data protection regulation by EU, Privacy data management.
1. Investment thesis
1) Growing industry
As discussed earlier, Japan is behind global peers, providing GRCS with a long runway for growth. See TAM section below for details.
2) Clear differentiators – What set them apart.
a) GRCS boasts 100 GRSC experts who have gone through the company’s proprietary training system
b) Extensive database on incidents and client needs built on 10 year track records which are only realized through its unique operating history as a GRCS specialized company
c) Ability to offer both consultation and products for which needs are surfaced via consultation by engineers.
3) Now in the profitable growth phase
The below left bar graph indicates that the company’s sales have grown at CAGR of 32% over the last 4 years. Right graph highlights that the company has gleaned the benefits of investments in system and workforce from FY 2016 through FY 2019 and started to generate profits in FYE 11/20.
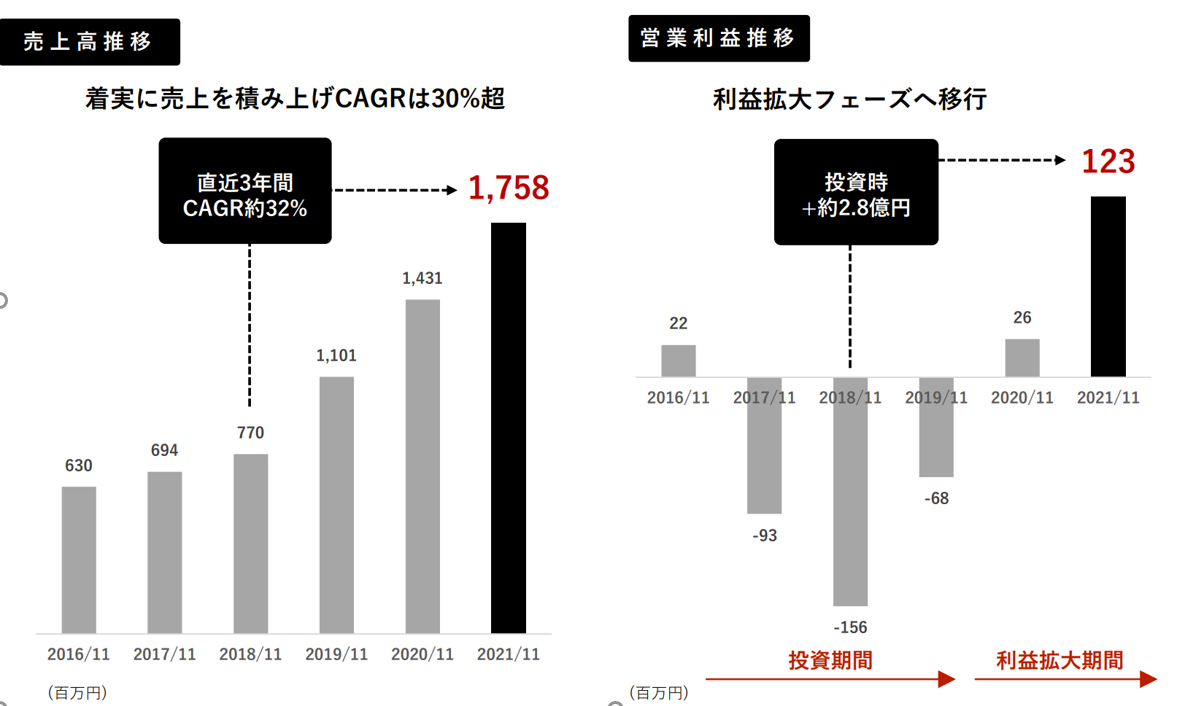 (Unit: JPY 0,000)
(Source: Financial Results Briefing for the Fiscal Year Ending 11/2021)
Gross margin also have steadily improved in FY 2021.
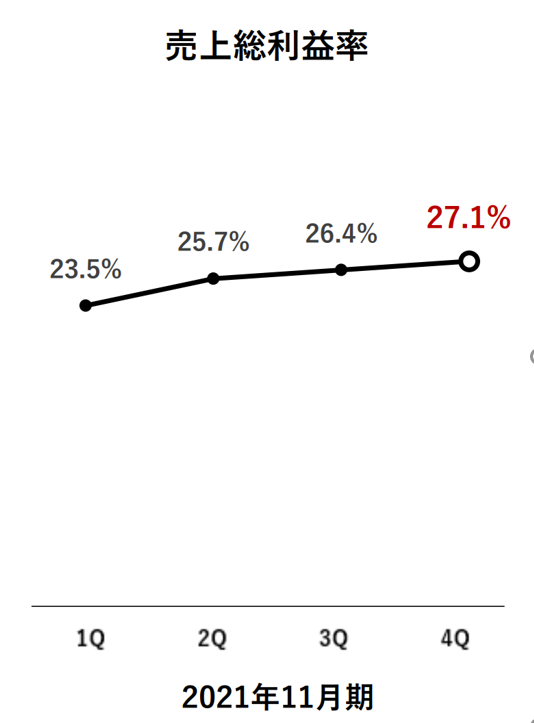
(Source: Financial Results Briefing for the Fiscal Year Ending 11/2021)
2. Technically Speaking
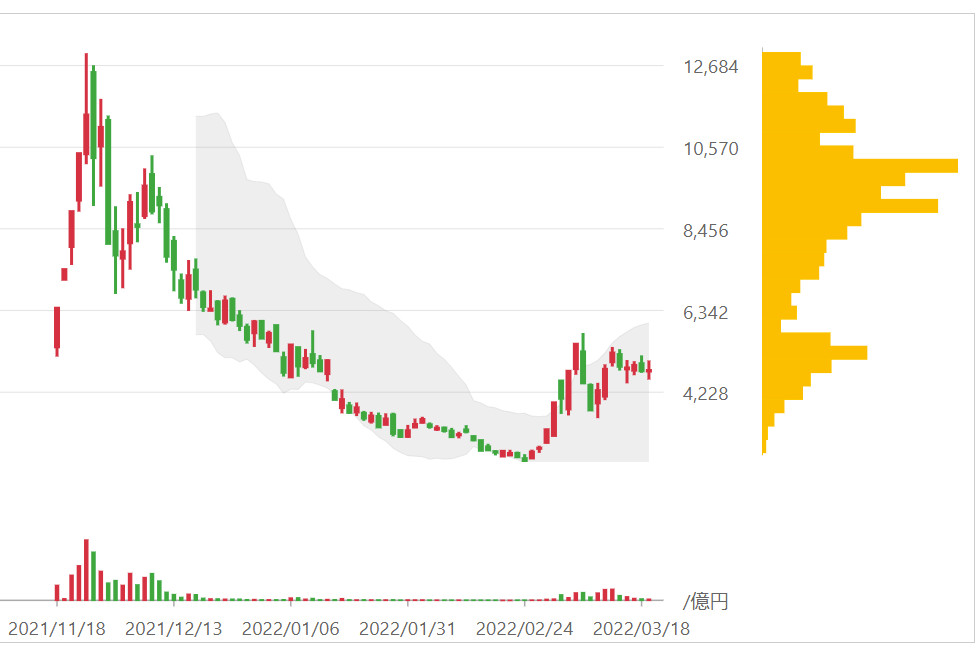
(Source: buffet-code.com)
The stock appears to have entered post-IPO rebound stage (so called “IPO secondary”). It is currently in the range bound at around JPY 5,000 digesting some earlier buyers itching to sell. Once the shares go through the current range, the stock should not face much resistance till the next volume cluster (JPY 8,500).
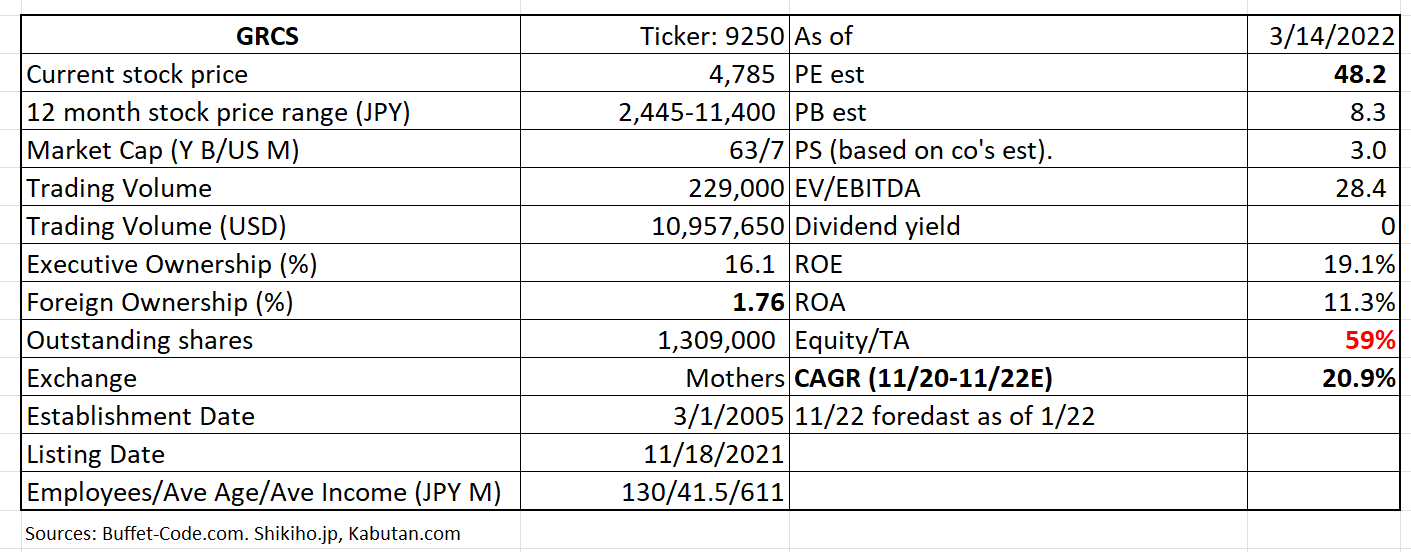
The stock trades at PE of 48X 11/22E vs. CAGR of 20 % which looks extensive, but acceptable supported by its status as a pure GRCS play.
3. Business Model
The company’s two businesses earn revenues differently:
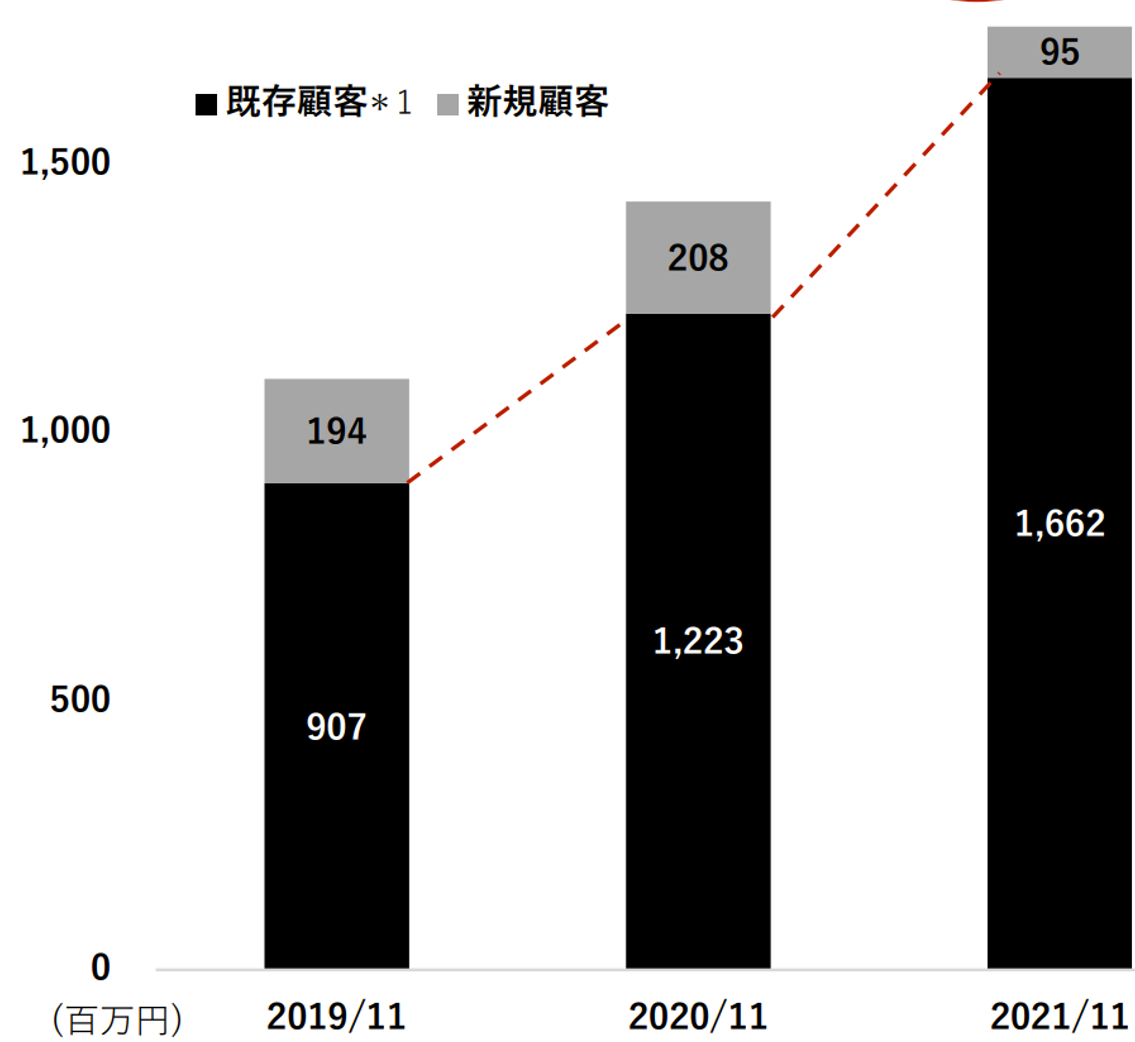
Solution group: Clients enter renewable 3 month contracts. As per management, some clients are 10 year customers. The below chart shows a rising number of existing customers as a % of total customers, highlighting positive votes by existing customers. For FYE 11/21, 95% of clients are existing (i.e. renewed) customers.
Product group: SaaS/subscription based business model.
(Source: Financial Results Briefing for the Fiscal Year Ending 11/2021)
4. Financial Highlights
Results for FYE 11/21 (12/20-11/22)
The last fiscal year results vindicate the company’s efforts to increase the sales to new clients and additional product sales to existing customers. Sales and profitability per a large ticket customer is higher. This was evident in gross margin improvement from 24% in FYE 11/20 to 27% in FYE in FYE 11/21 and operating profits from 1.8% to 7%.
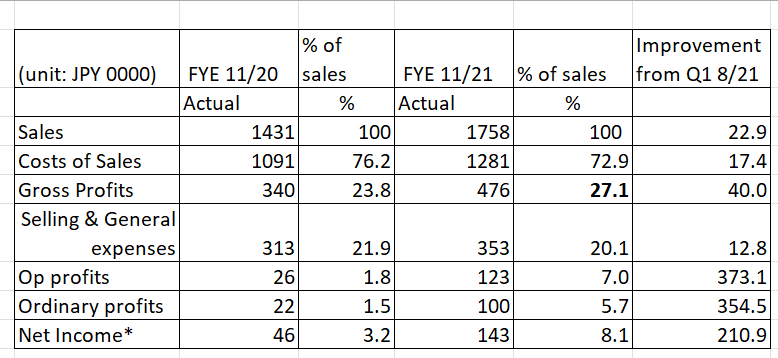
*Net income for FYE 11/21 includes income tax adjustment of JPY 630,000.
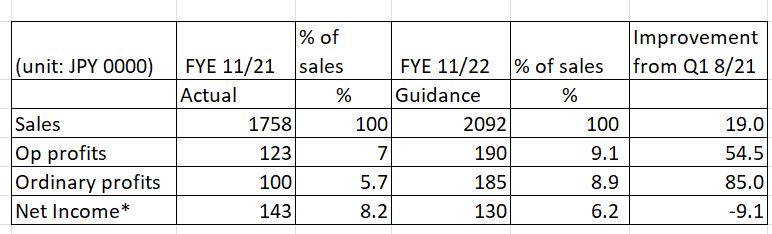
FYE 11/22 Guidance.
(Source: Financial Results Briefing for the Fiscal Year Ending 11/2021)
The company sees that sales will increase in FYE 11/22 mainly through up-sell (incremental product offering) to existing customers. New product launches include 1) AML (anti money laundering) and 2) ESG focused operations.
Without income tax adjustment of JPY 630,000, net income is expected to increase by 62%.
5. Total Addressable Markets (TAM)
The first bar graph illustrates that Japanese security market will grow at steady 4.5% from 2020 through 2023.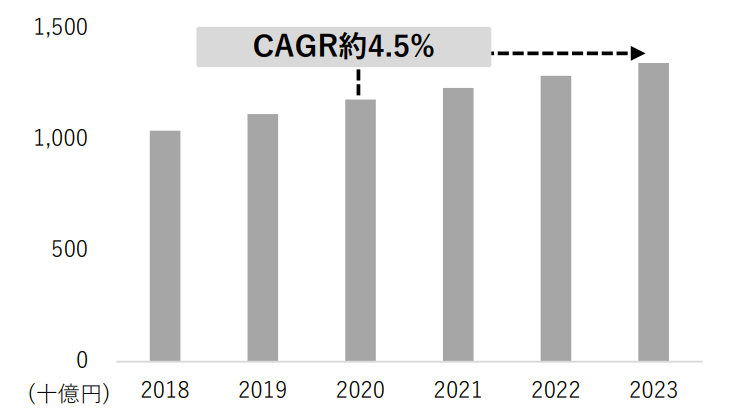
(unit: JPY Billion)
(Source: IDC, taken from (Source: Financial Results Briefing for the Fiscal Year Ending 11/2021)
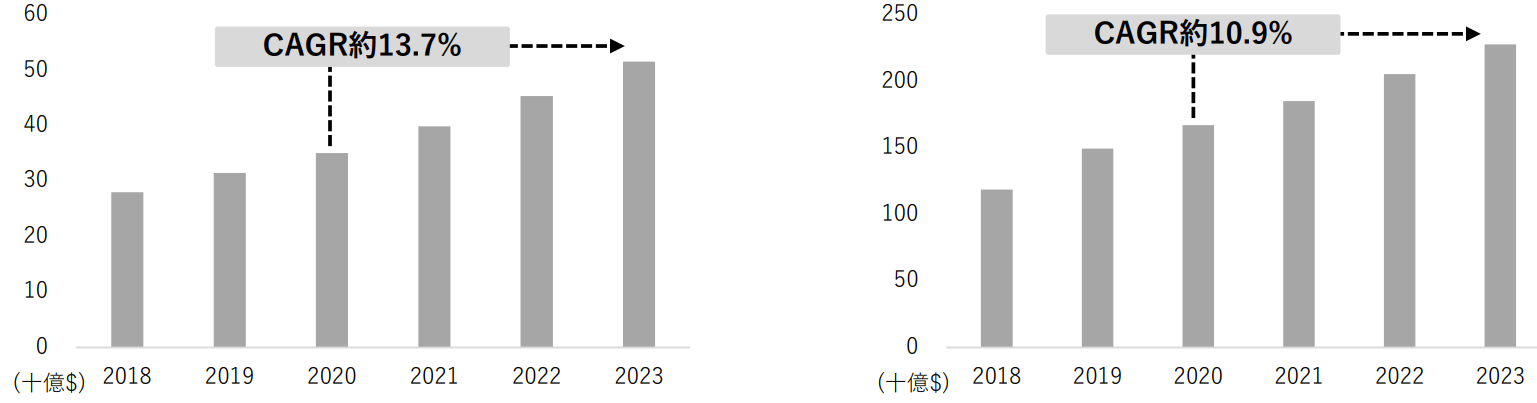
(unit: JPY Billion)
(Source: Grand View Research/Enterprise Governance, Risk & Compliance Market Report, 2021-2028, taken from (Source: Financial Results Briefing for the Fiscal Year Ending 11/2021)
The above two bar graphs expect that global GRC (left) and security markets will grow at 13.7% and 10.9%, respectively. Therefore, we can conclude that operating environments for CGRC is supportive.
6. Strengths and Weaknesses
Strengths
1. No Direct Competitor
There are many players who offer services/products in the areas of GRCS individually. However, at this point, the company is the only pure play which can provide GRCS services under one roof. Thus, its services are price competitive, since the clients do not have to shop around and package them by themselves.
2. Growth strategy-Logical
The company classifies the existing clients into 5 groups based on its sales sizes:
Below Phase A: Sales below JPY 10 MM ($100 M): Color in the horizontal bar graph = Light gray
Phase A: JPY 10 MM <sales>JPY 30 MM, Dark Gray
Phase B: JPY 30 MM <sales>JPY 50 MM, Black
Phase C: JPY 50 MM <sales>JPY 100 MM, Orange
Phase Z: Sales>JPY 100 MM ($1 MM), Red
Growth plan 1: upsell and cross sell the products to Phase A and below Phase A clients to bring them up to Phase B and higher group.
Growth plan 2: Expand the numbers of Phase A and below Phase A customers who will be Phase B and larger clients. The company also intensifies marketing efforts to financial institutions which face tighter regulations, thus compliance requirements are high.
As illustrated, the clients who belong to Phase B, C and Z account for 14% of total numbers of customers but generate 73% of GRCS’s sales.
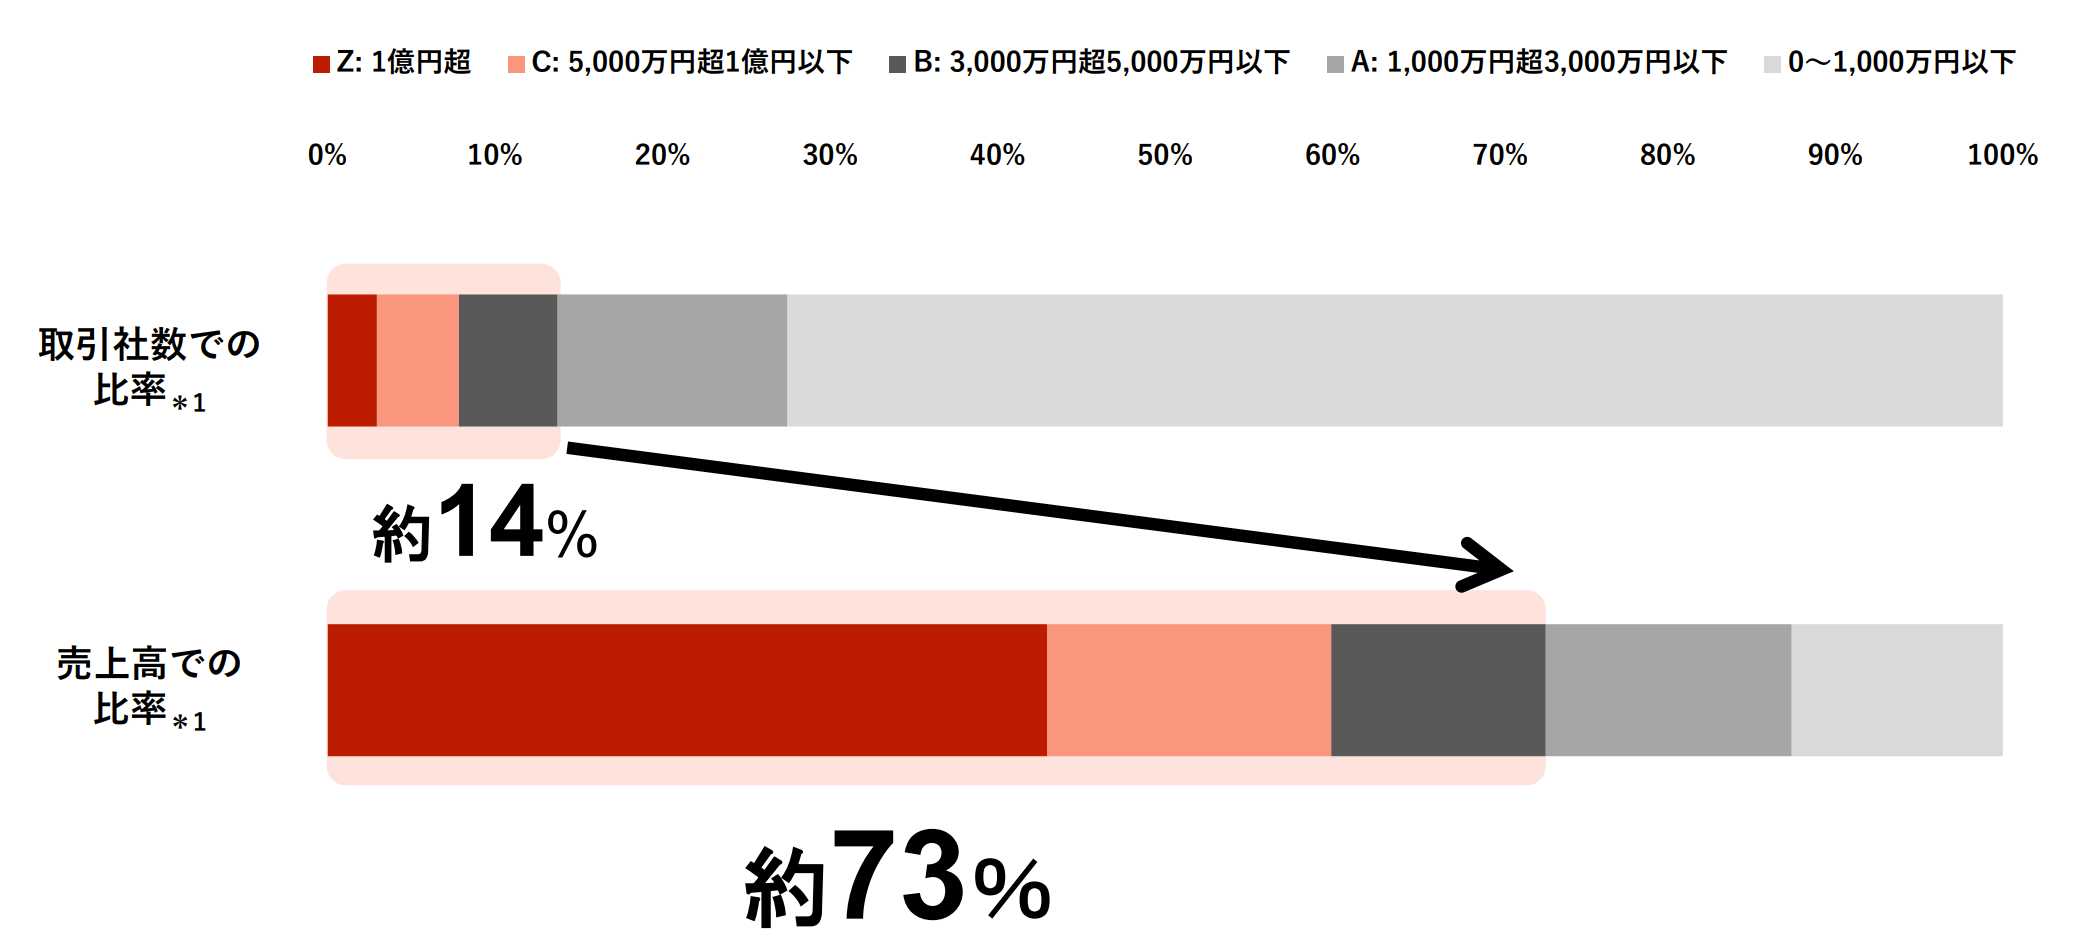
(Source: Financial Results Briefing for the Fiscal Year Ending 11/2021)
Weakness
Mizuho Securities accounted about 30% of FYE 11/21 sales. As you might have heard, Mizuho group has been dealing with numerous outages of ATM system and other technical issues post-integration of Dai–Ichi Kangyo Bank, Fuji Bank, and the Industrial Bank of Japan.
These merged banks are all sizable in their own rights with legacy banking systems. ATM outages and the resulting inability to satisfy their customers’ liquidity needs has led to top management turnover. The repeated system outage by the Japan’s 2nd largest bank has not helped consumers’ trust in the overall banking system either.
If any bank needs services of GRCS, that would be Mizuho. Nonetheless, the existence of a 30% customer makes GRCS vulnerable. To mitigate this high dependence, the company is making efforts to expand its sales to other large customers as discussed in the previous section.
7. Near-term Selling Pressure
As noted in useful tips section of www.JapaneesIPO.com, when the stock’s outstanding margin buy volume is high and rising, that will function as the near-term selling pressure. For GRCS, the current margin buy outstanding volume is 1- 2 day worth of trading volume. Thus, the near term selling pressure is not a big concern.
Margin trading unit (1,000):
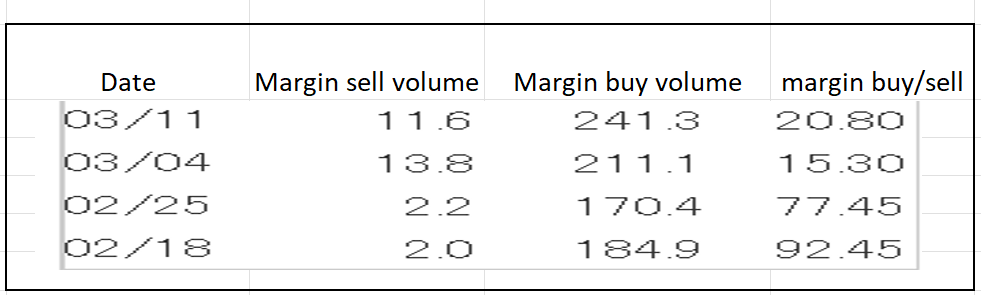
(Source: Kabutan.com)
[Disclaimer]
The opinions expressed above should not be constructed as investment advice. This commentary is not tailored to specific investment objectives. Reliance on this information for the purpose of buying the securities to which this information relates may expose a person to significant risk. The information contained in this article is not intended to make any offer, inducement, invitation or commitment to purchase, subscribe to, provide or sell any securities, service or product or to provide any recommendations on which one should rely for financial securities, investment or other advice or to take any decision. Readers are encouraged to seek individual advice from their personal, financial, legal and other advisers before making any investment or financial decisions or purchasing any financial, securities or investment related service or product. Information provided, whether charts or any other statements regarding market, real estate or other financial information, is obtained from sources which we and our suppliers believe reliable, but we do not warrant or guarantee the timeliness or accuracy of this information. Nothing in this commentary should be interpreted to state or imply that past results are an indication of future performance