Workman, once a darling among investors, is now trading at around ¥4,500, a decline of more than 50% from its 2020 high of ¥10,570.
I believe Workman is not new to you, thus, this note serves to update you on new developments which I believe may signal a (very) early sign of recovery.
From a shop selling only highly functional and low-cost workwear, Workman has since expanded and now has specialty stores such as WORKMAN Plus, (launched in 2018) focusing on outdoor goods for general customers, and WORKMAN Girl (2020), targeted at female customers.
New growth initiatives:
The company has recently launched a new business initiative, called WORKMAN Colours, to become a store chosen for its style and design as a fashion brand. 95% of its stores are franchisee-operated. Its balance sheet is solid with an 85% capital ratio.
To grow its functional apparel line, which is the foundation of the Workman brand, Workman is adding unique features to casual items, such as pollen-resistant materials and materials less prone to insect bites.
Q. Why did the stock lose its allure?
A. The company’s same-store sales had been on a declining trend.
For the period 4/18 -4/20:
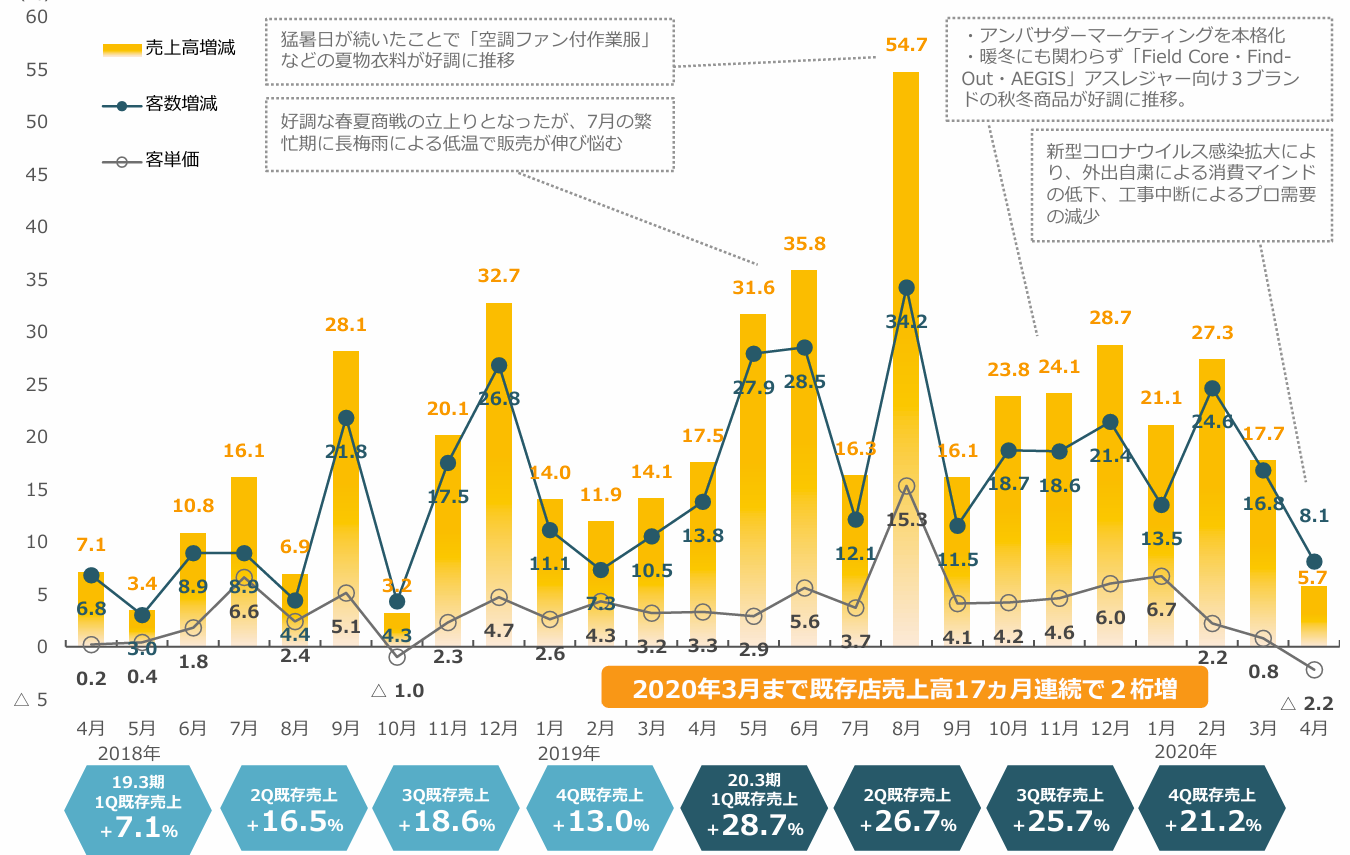
(Source: company)
While this chart is in Japanese, I will highlight the important points. The company reported robust same-store sales, as shown in the blue hexagon diagram at the bottom. In fact, same-store sales, represented by the orange bar, were up by 20% throughout 2020. The notable 55% jump in same-store sales in August 2020 was due to brisk sales of fan-installed work shirts during the blistering summer month. The line graph with dark dots tracks the number of customers, while the line graph with light dots follows the trend of sales amounts per customer.
For the period: 1/20 – 3/22:
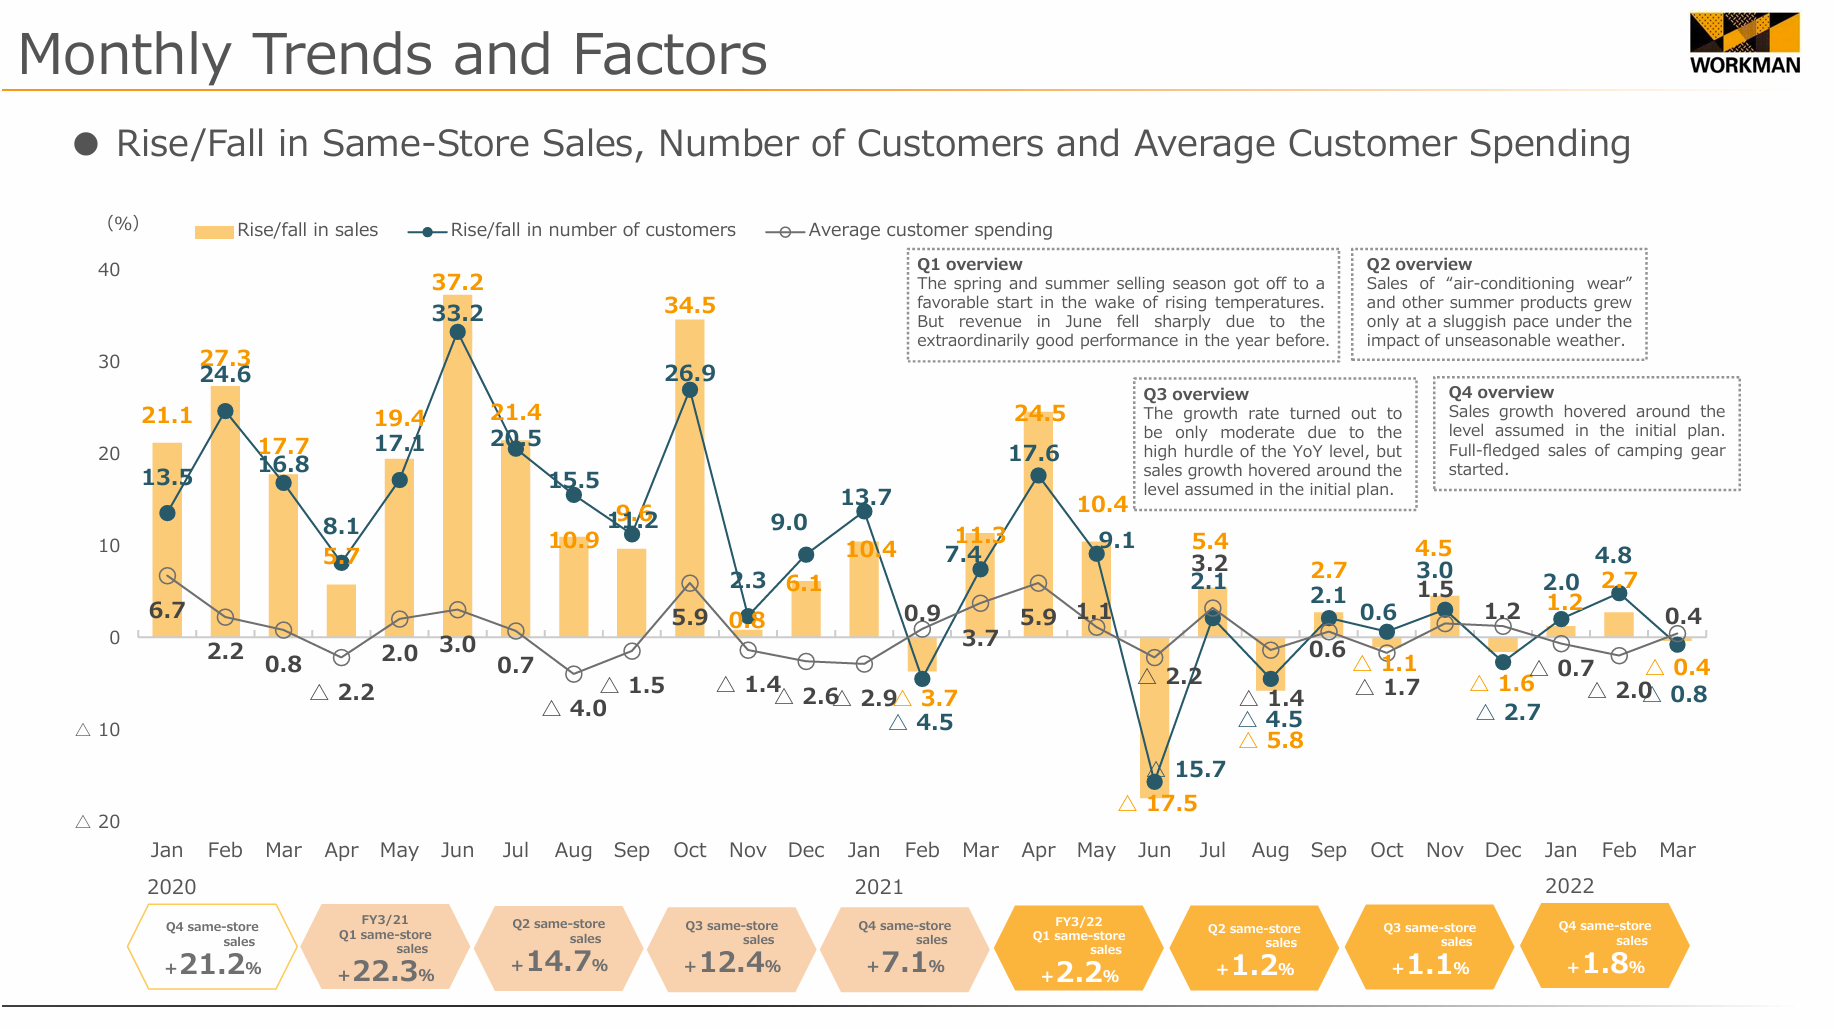
(Source: company)
In 2021, the increase in same-store sales began to decline, partly due to y/y comparison and a decrease in work clothes sales caused by construction halts as a result of COVID-19. Unseasonable weather patterns (a warm winter and a colder early summer) also dampened customer traffic. In 2022, sales of work shirts with built-in fans were sluggish as the effectiveness of the fans became questionable.
For the period:1/22 – 3/24
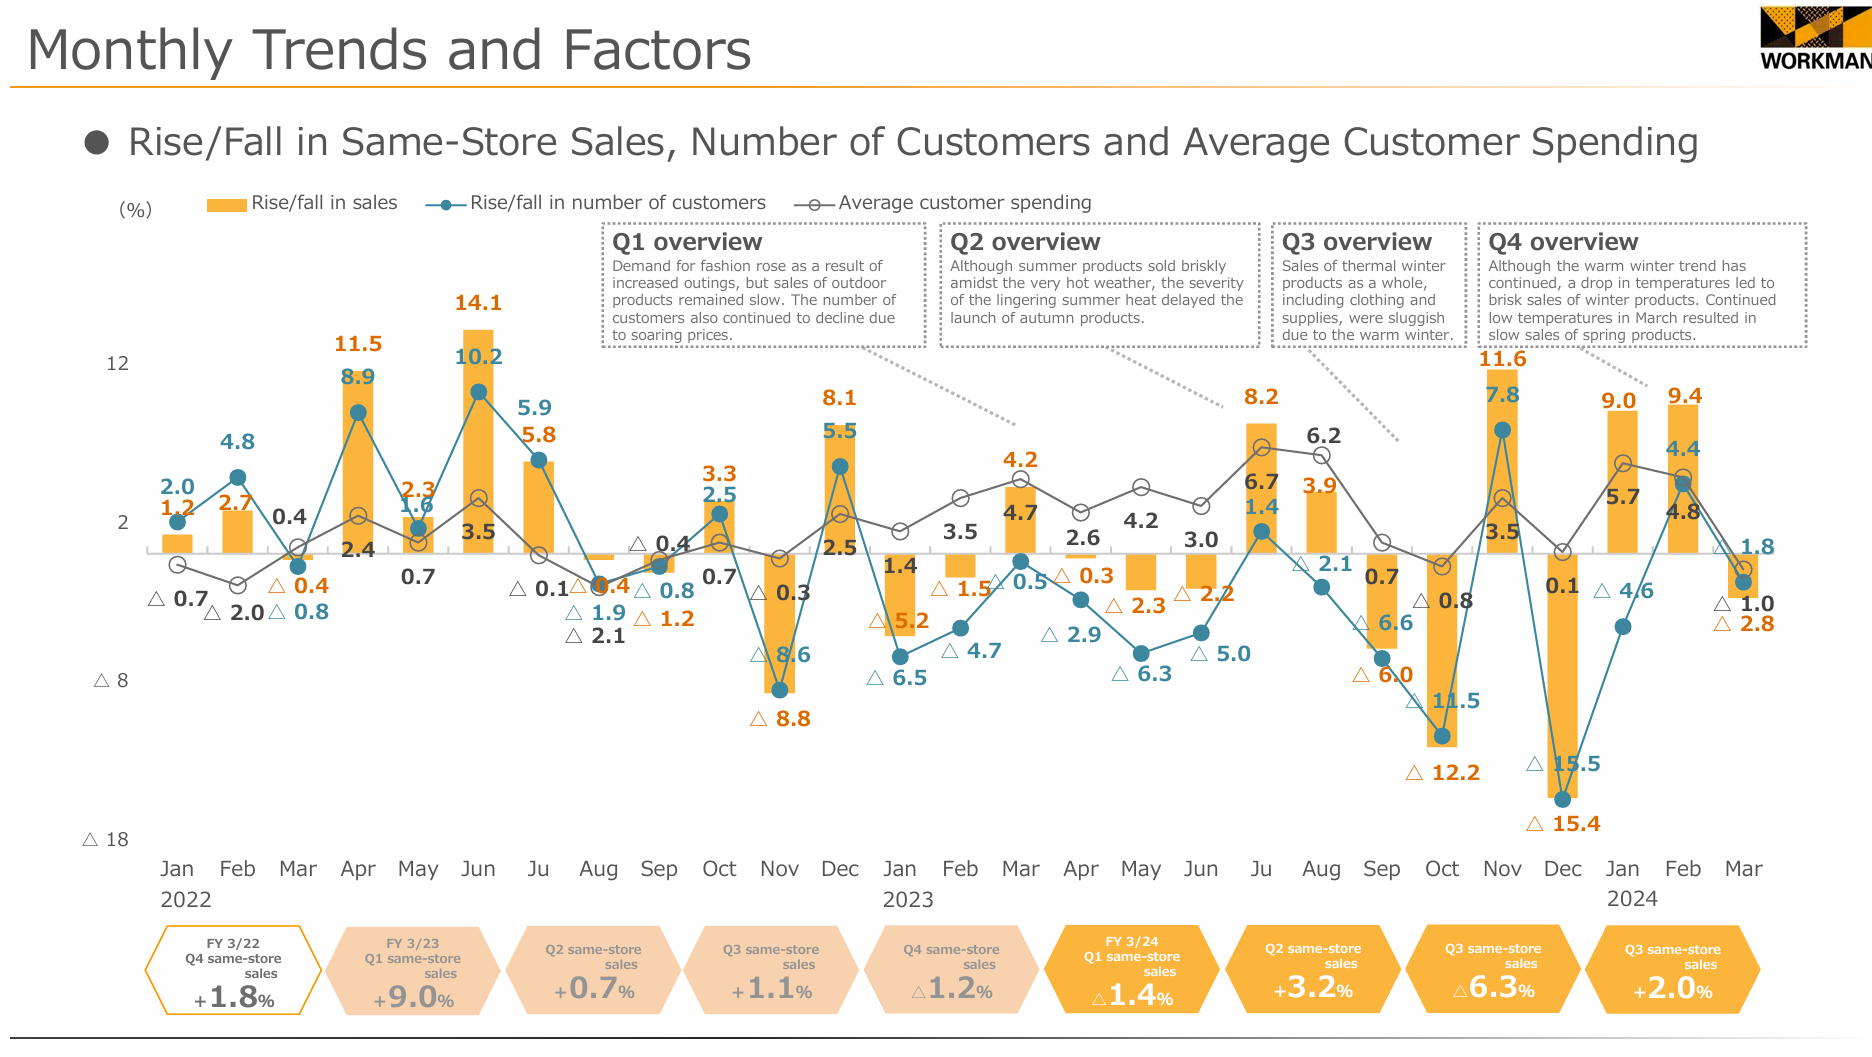
(Source: company)
In 2023, the negative impacts of a weak yen became pronounced, forcing Workman to raise prices, which in turn discouraged customers from visiting stores. Additionally, unfavorable weather patterns, such as a longer summer reducing the sale of fall items and a longer winter reducing the sale of spring clothing, further impacted sales. This led the company to lower its FY3/24 guidance (OP -9%) on February 5, 2024.
However, the aforementioned new initiatives, such as new concepts and influencer collaborations, appear to be bearing fruit. A comparison of same-store results for FY3/25 (April through August) with the full year FY3/24 shows an improvement in sales and customer visits in the first five months of FY3/25, although sales per customer are still lower.
(Source: company)
Now that exchange rates are turning toward a stronger yen, cost hikes should ease, benefiting Workman’s profitability. The company may also be able to lower prices, which could bring cost-conscious customers back to the stores.
Valuation:
(source: shikiho)
In terms of valuation, Workman is not trading at a significant discount. However, with early signs of same-store sales recovery, it may be worthwhile to keep an eye on the company. The recent improvements in sales and customer visits suggest a growth potential, making Workman an interesting prospect for investors looking for recovery plays and a stronger yen beneficiary.
[Disclaimer]
The opinions expressed above should not be constructed as investment advice. This commentary is not tailored to specific investment objectives. Reliance on this information for the purpose of buying the securities to which this information relates may expose a person to significant risk. The information contained in this article is not intended to make any offer, inducement, invitation or commitment to purchase, subscribe to, provide or sell any securities, service or product or to provide any recommendations on which one should rely for financial securities, investment or other advice or to take any decision. Readers are encouraged to seek individual advice from their personal, financial, legal and other advisers before making any investment or financial decisions or purchasing any financial, securities or investment related service or product. Information provided, whether charts or any other statements regarding market, real estate or other financial information, is obtained from sources which we and our suppliers believe reliable, but we do not warrant or guarantee the timeliness or accuracy of this information. Nothing in this commentary should be interpreted to state or imply that past results are an indication of future performance.