Treasure Factory (3093) – 10 ways to create your treasures
Note: Some excel tables could not be uploaded here. If you are interested in numerical data of Treasure Factory, please visit my LinkedIn Group “Decoding Japanese Stock Anomalies”
Summary Update:
So far I have published reports on three Japanese reuse/discount retailers: Treasure Factory in (1/23), Geo (10/22), and Pan Pacific International (5/22).
The investment thesis behind these names is based on three positive factors:
- Under an inflationary economy, Japanese consumers will prefer quality products at discounted prices.
- The post-Covid reopening of the economy and the weak JPY will attract more visitors to Japan (inbound visitors).
- The weak JPY will also make high-end brand items more affordable to visitors, increasing the revenues of these reuse retailers.
These positive factors are still intact. Weak Yen seems to last longer since US FRB may keep their overnight rates higher longer than initially expected.
What has changed is investment sentiment shift toward Japanese equity in general. This shift was triggered by two events:
- The news of Warren Buffet buying stakes in five Japanese trading firms.
- The TSE’s calls for companies to improve their ROE or face delisting.
As a result, foreign investors who had previously avoided Japan have started to invest in Nikkei (large caps). Meanwhile, Japanese retail investors have flocked to high-dividend stocks to take advantage of the tax rule on the new NISA (Nippon Individual Saving Account). The new NISA offers permanent tax exemptions with certain investment amount limits.
Who is Treasure Factory?
Treasure Factory (“TF” or the company) is one of the major retailers of reuse products. Their product lineups span from clothes, sports and outdoor goods. Their subsidiaries include: Kindall (pre-owned brand items) and Golf Kids. It has collaborations with moving service providers to buy items which will be discarded.
Their mission statement well summaries their appeals to customers and investors:
A factory for finding new value in used goods. With a rich lineup of rare “one of a kind” products, the company provides customers with the joy of buying, selling, and discovering unique products in one stop and nowhere else.
1. Investment thesis
1) Industry tailwind
(Source: Company)
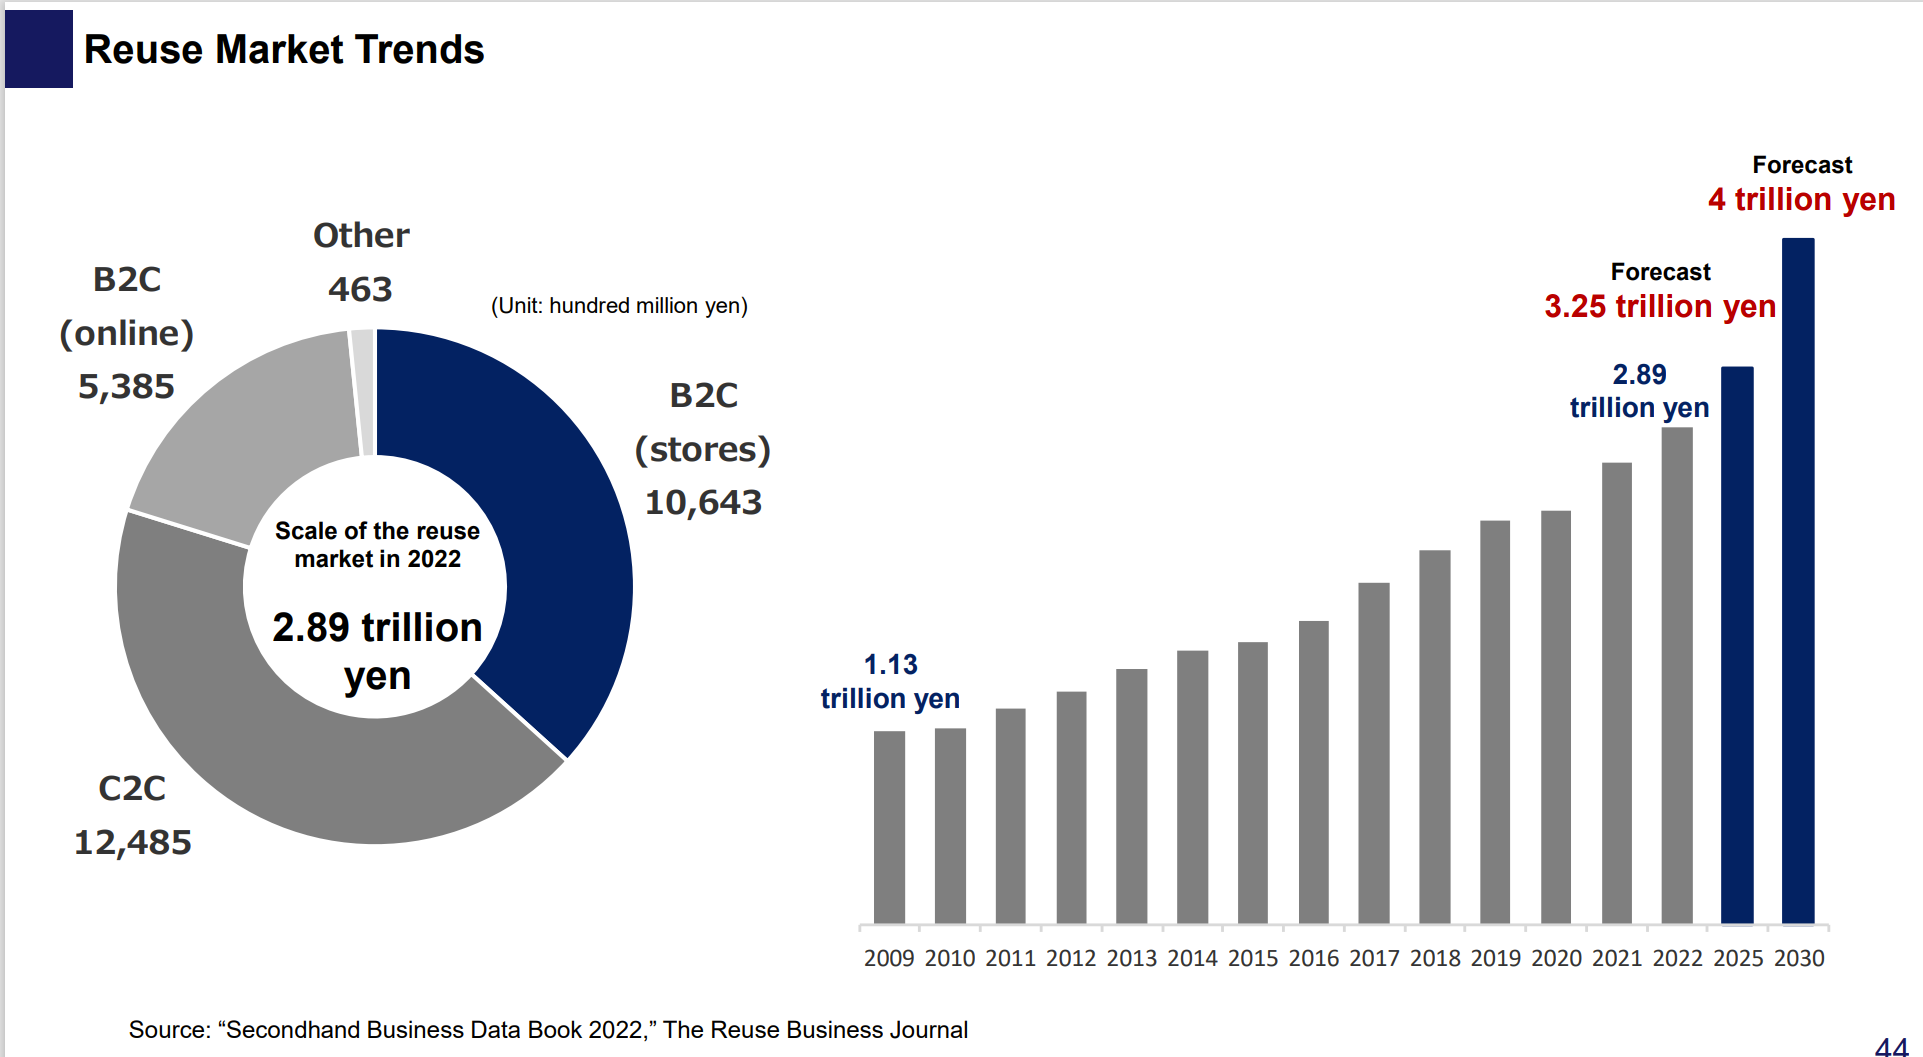
The Japanese reuse market is expected to grow from JPY 2.89Tn in 2022 to JPY 3.25Tn in 2025 at CAGR of 4% and at CAGR of 4.24 % from 2025 to JPY 4Tn in 2030.
Driving factors of this growth:
We believe that the below factors contribute to the increase in reuse demand:
1) Emphasis on environmental sustainability
2) High living standard in the past has led to an abundance of lightly used quality items
3) No salary increase during the last three decades have created a sense of frugality among many Japanese citizens.
The implications for TF:
- The growth of the industry as a whole should drive TF’s sales.
- The size of the reuse market in 2022 was JPY 2.8976 Tn. Of that, the market size of clothing and fashion goods was JPY 511.9 Bn, an increase of 11.6%, compared to the previous year. The reuse of used clothing accounts for more than 17% of the entire reuse market.
- TF’s apparel sales, which account for about 40% of the group-wide sales, were JPY 12.92 Bn and ranked 3rd.
#1 and #2 are:
#1: Geo JPY 59.0 Bn
#2: Zozo JPY 15.69 Bn (Zozo is known for its online presence)
TF, as a solid #3 player, is in a good position to catch up with the two apparel leaders.
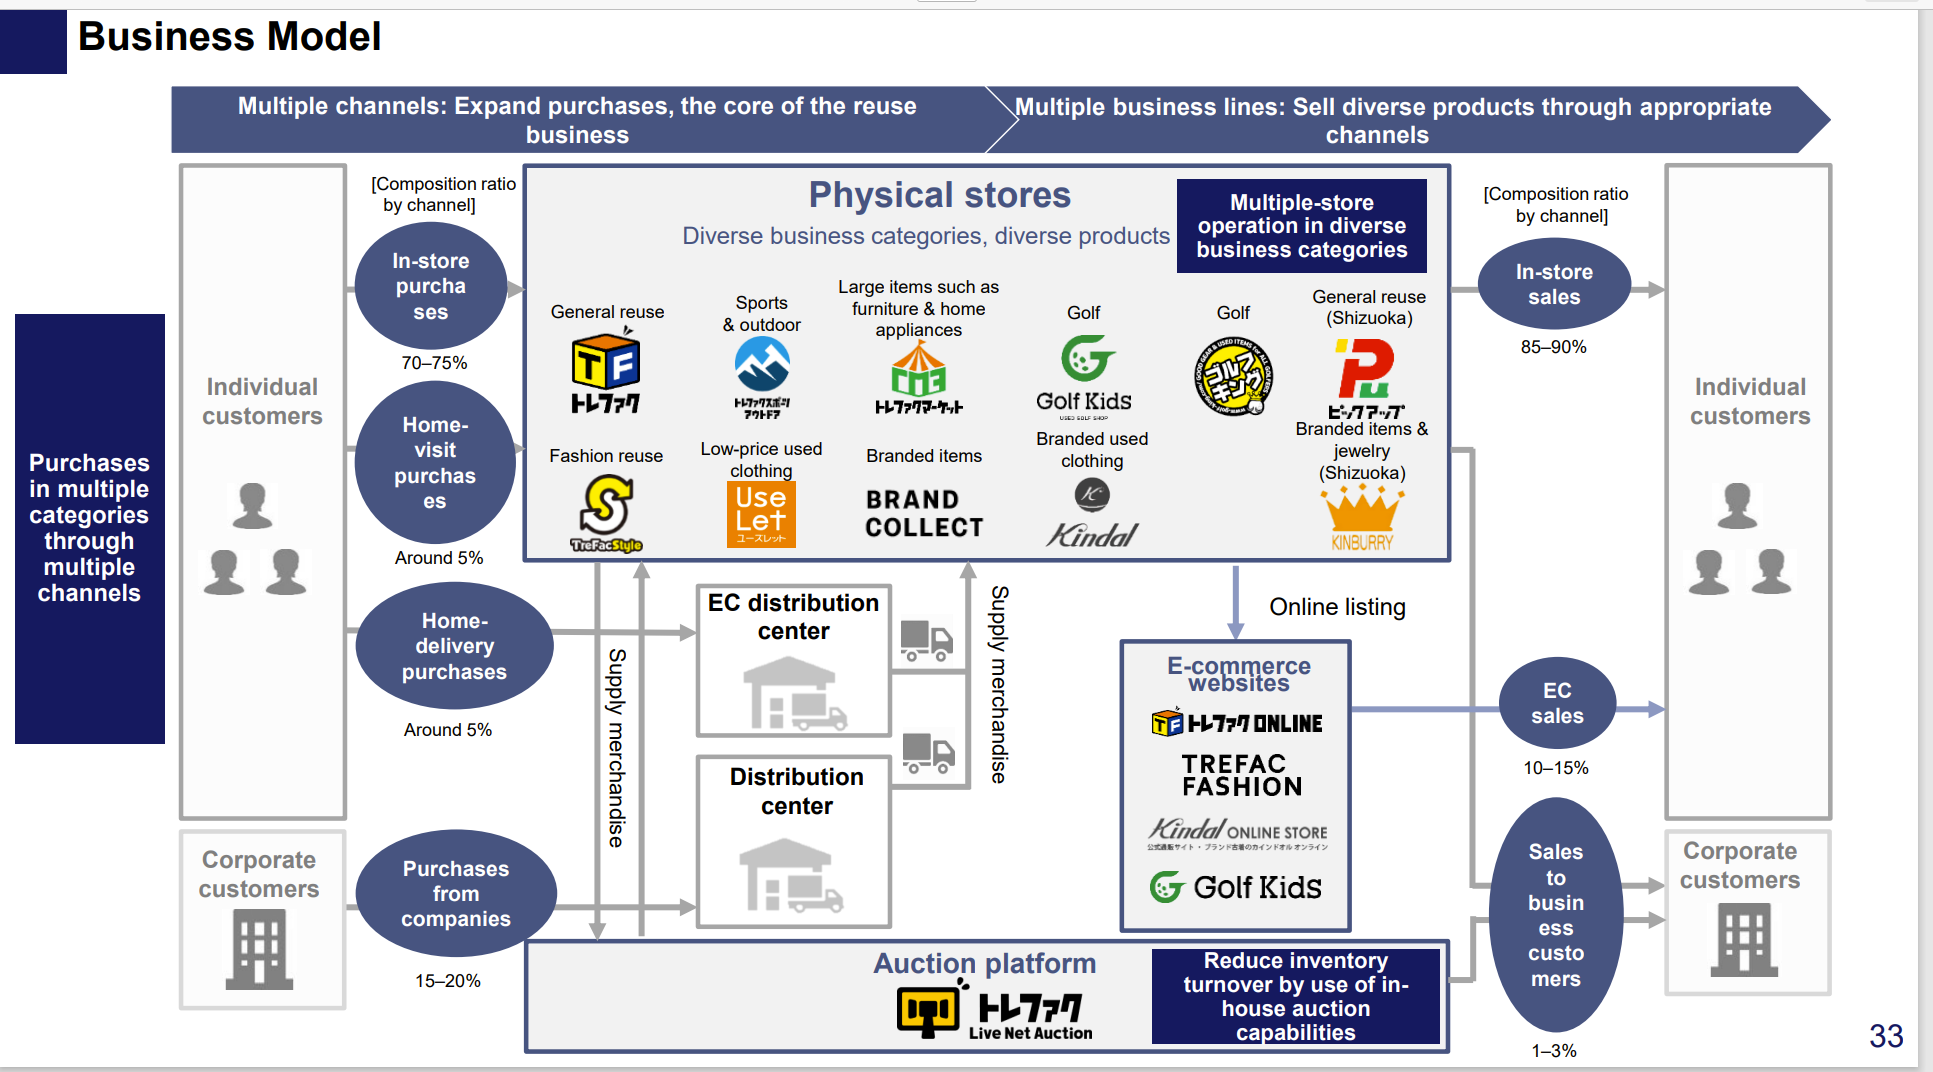
2) Robust business model, supported by “Multi Products and Multi Channels”
(source: company)
Product procurement –
The Company buys its merchandise through multiple sources:
1) physical stores, 2) online, 3) home visits, 4) professional sellers and 5) moving companies.
Sell points –
Physical stores
Their 10 brick and motor concepts are specialized in type of merchandise, based on price range and product types. For example, Treasure Factory handles all the products and price ranges. Treasure Factory outdoor handles sports, Brand Collect sells used high-ticketed brand-name goods, and Use Let focuses lower-end clothing. These different stores are placed at respectively suitable locations. For example, high end good stores (Brand Collect ) are situated at the center of big cities and large pieces of furniture are sold at Treasure Factory Market built along major road sides.
Online
The 4 online selling sites are also specialized in selling certain product lines. For example, kindale on line focuses on used high end clothing.
Auction –
The company’s own auctioning site provides it with both buying and selling opportunities. Auctions increase product turnovers by allowing TF to liquidate slow-moving items and enhance the chance to discover hard-to-find items.
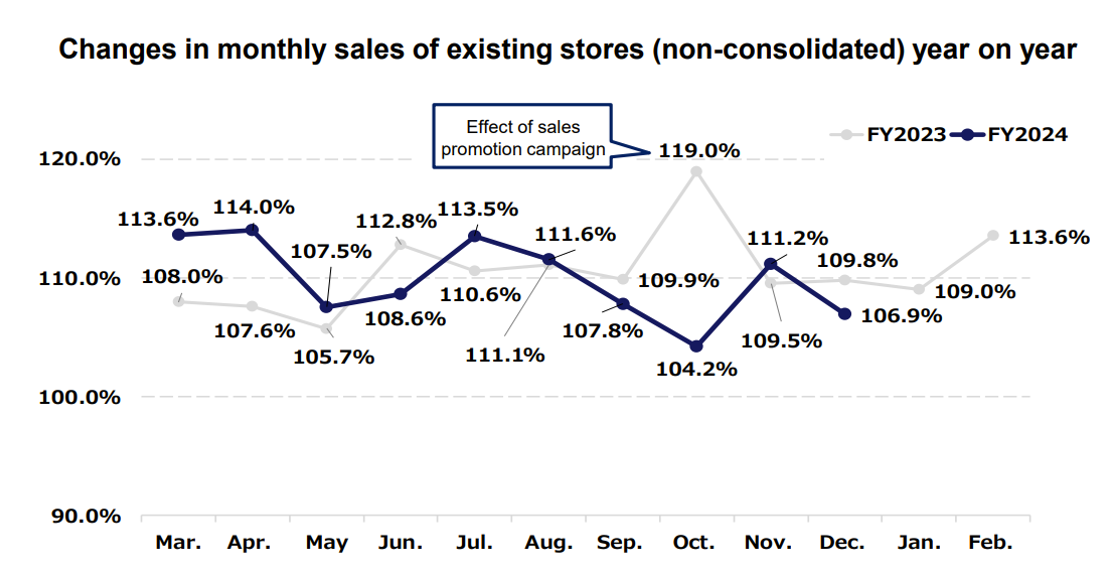
3. Strong same-store trend
The main KPI (key performance indicators) for a retail company are growth in same-store sales and total store counts.
(Source: company)
TF’s same-store sales grew YOY for 28 consecutive months from 9/21 through 12/23 (the lines stayed above 100% in the graph above). Crisp apparel sales and strong sales of high-ticked items fueled this strong same-store performance.
The company aims to open 25-30 new stores per year. To finance these new store openings, the company plans to use bank loans as well as internally generated cash. Operating cash is expected to be around JPY 1,700MM – 2,000MM/year (similar to the 2/23 level). The net increase of bank borrowing in three years is JPY 500-600 MM, a 14% increase from JPY 4,371 MM as of 8/23. Given TF’s high capital adequacy ratio of 48.9%, it should be able to handle a higher debt load to support its growth.
TF’s 10 retail concepts enable the company to reach different segments of customers and offer more opportunities for new store openings. That is why the company believes that opening 25-30 stores per year is very feasible for the next several years.
4. Reasonable valuation
I have chosen 4 reuse stocks as TF’s peers (Geo, Komehyo, BookOff and Pan Pacific International)
5 stocks’ average PE is 15.2x, lower than Nikkei Average PE of 16.07x as of 2/9/24. Pan Pacific carries the highest multiple, driven by 1)its global presence, 2)long history (established in 1980), 3)large scale (619 stores). Also, the current market rewards the larger cap names.
I believe TF’s multiple can gradually expand to that of Pan Pacific’s. It is 15 years junior to Pan Pacific and its store footprints are much smaller at 190. Its overseas operations have just begun with stores in Thailand and Taiwan. Nonetheless, TF has unveiled its sound growth strategy to capitalize on the thriving reuse market.
5. Two consecutive years of upward revision (for FY2/23 and FY2/24).
The company continues to surpass its historically high-profit level. As a result, the company upward-revised its full-year FYE 2/24 numbers on 2/14/24 from guidance given on 10/23: Sales were boosted by 2.5% and net profits were increased by 6.6%, from the initial guidance.
Toyo Keizai believes that management is conservative. It estimates that FY2/24 operating profits will be JPY 3,500 MM (35% increase Y/Y)
Dividends are also upped from JPY 25 to JPY 28 (+12%).
FY 2/25 Forecast:
While the company has not released its FY 2/25 guidance, Toyo Keizai estimates it at 9.9%.
6. Bouncing back from the past setbacks
Management has acknowledged and learned from their previous mistakes in merchandising and launching new stores.
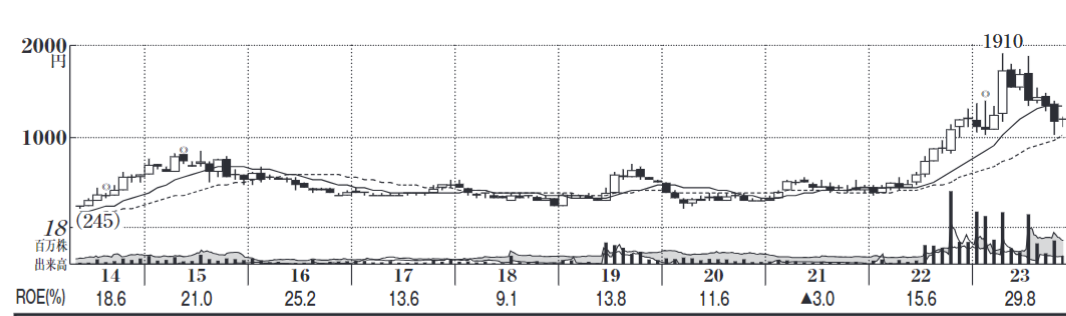
(source: Japanese company handbook, published on 12/18/23)
In the above chart, TF’s ROE declined in 2017 and 2018. During these years, the company faced challenges in finding the right fit with customers on new store locations and merchandising. However, during the earnings call for FY 2/18, management reported that the improvements on both stores and merchandising were showing early signs of success, which was evident in an increased ROE to 13.8% in FY2019.
ROE improvement was interrupted by Covid but the positive trend resumed in 2022 and ROE reached an impressive level of 29.8% in 2023 as shown in the below slide (available in TF’s earnings presentation).
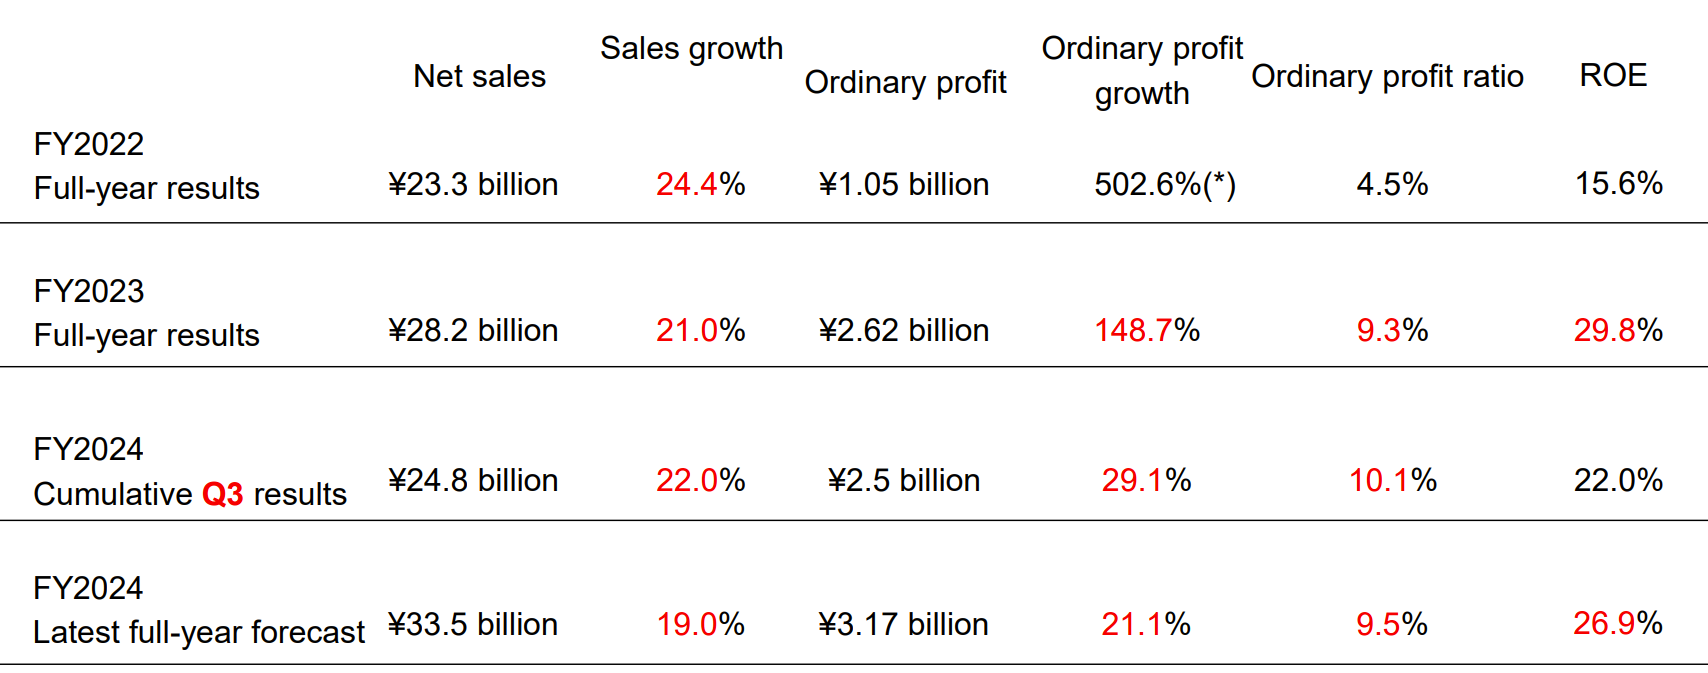
Note:
1. Ordinary profits include operating profits +/- non operating profit/expenses (mainly interest income/expenses).
2. FY 2022 ordinary profit growth of +500% is due to post Covid return to normal commerce.
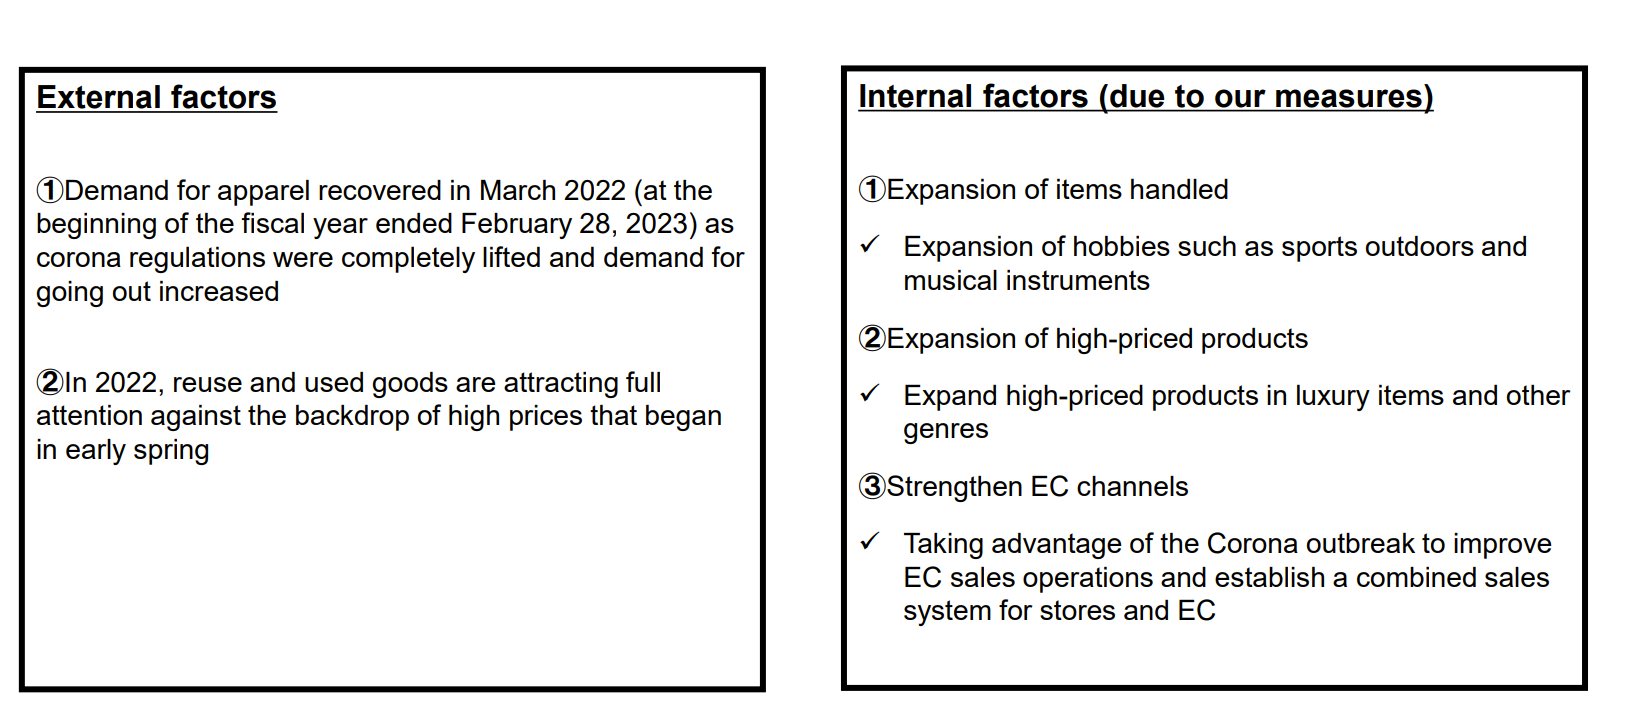
The below table summarizes the factors which contribute to these growth by their own words (again this is excerpt of their earnings slide).
7. Use of “Customized IT System” to drive efficient operations
The industry’s total reuse sales consisted of 43% consumer transactions (C to C or peers to peers). In contrast, TF’s sales mainly came from brick-and-mortar stores (85-90%), with only 10-15% from its website.
Buying high-end used items requires accurate appraisal, which is why physical presence has been crucial for building inventory. However, the company is developing a technology-based appraisal system that will enable more cost-efficient online procurement.
The company’s system collects and analyzes customer data and adapts its product line-ups accordingly. This way, the company can manage its inventories to suit the changing consumer preferences.
2. Weakness
Competitive market place.
As often the case with an expanding industry, the reuse industry is attracting new entrants. Also, the other players, such as GEO, which are shifting their focus from solely dealing with new products to also offering used items. Nonetheless, TF is in a good position to fend off new and old competitors with its scale and customer recognition.
[Disclaimer]
The opinions expressed above should not be constructed as investment advice. This commentary is not tailored to specific investment objectives. Reliance on this information for the purpose of buying the securities to which this information relates may expose a person to significant risk. The information contained in this article is not intended to make any offer, inducement, invitation or commitment to purchase, subscribe to, provide or sell any securities, service or product or to provide any recommendations on which one should rely for financial securities, investment or other advice or to take any decision. Readers are encouraged to seek individual advice from their personal, financial, legal and other advisers before making any investment or financial decisions or purchasing any financial, securities or investment related service or product. Information provided, whether charts or any other statements regarding market, real estate or other financial information, is obtained from sources that we and our suppliers believe reliable, but we do not warrant or guarantee the timeliness or accuracy of this information. Nothing in this commentary should be interpreted to state or imply that past results are an indication of future performance.