Loadstar Capital (“Loadstar” and the “Company”) operates through the following business divisions:
1. Corporate Funding: handles real estate investment and leasing.
2. Asset Management and Brokerage: manage real estate properties and consulting for the clients.
3. Crowdfunding: operation of “OwnersBook” which enables real estate companies to fund their own real estate transactions.
With just announced results for FY 2021 (ended 12/31/21), Loadstar recorded 9th consecutive year of sales and profit growth. With a 27% profit growth expected for FY 2022, the company aims to report 10th consecutive year of profit growth. The Company focuses their investment in Tokyo central area (23 wards).
1. Investment thesis
1. Supportive Industry backdrop
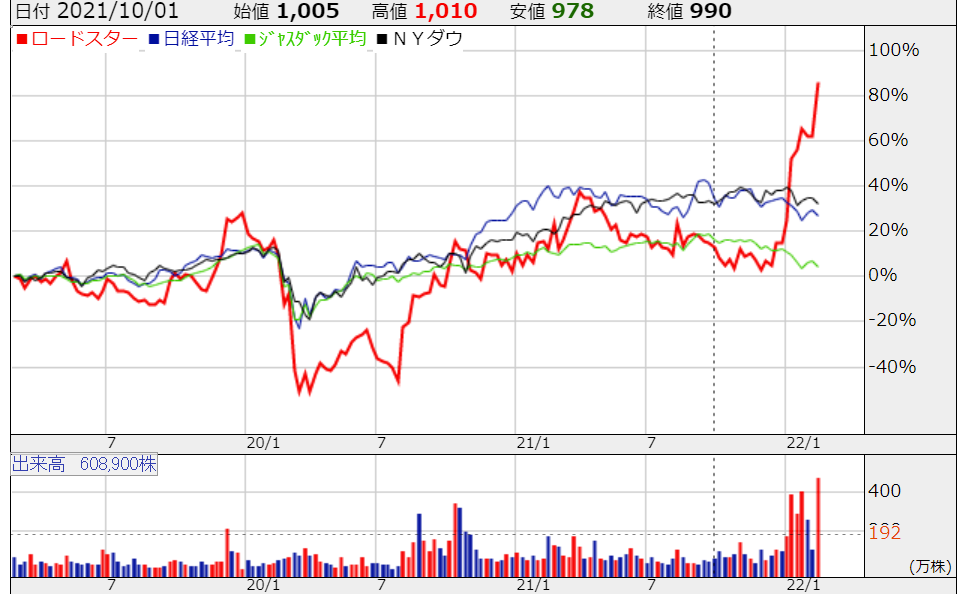
(Source: Kabutan.com)
The above chart shows Loadstar share performance for the last three years (2/22/19-2/18/22) compared to Nikkei (purple), Jasdaq (green) and Dow (black). Loadstar’s outperformance since the beginning of 2022 is pronounced and supported by strong real estate markets in Tokyo. Thus, one of the investment considerations should be to check if Tokyo office market’s strength will be sustained.
Question: Will Tokyo office building market continue to attract (foreign and domestic) institutional investors when the economy stagnates under the weight of population decrease?
Answer: Yes for mid-term. Since office buildings supply/demand balance will dictate the office market conditions. Also, while population will decline in Japan, Tokyo, as an economic hub, will have highest city GDP in the world in 2025 as shown below. Y axis: city population, X axis: GDP.
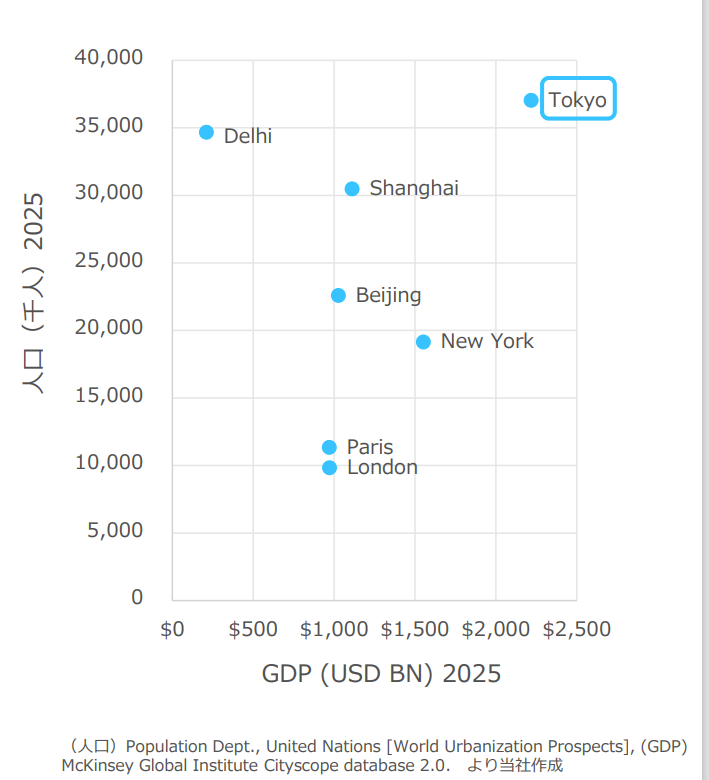
(Source: Financial Results Briefing for FYE 12/31/21)
Supply of office spaces (noted as “availability” in the below chart) is inversely related to the rent. That is, the higher availability, the lower the rents.
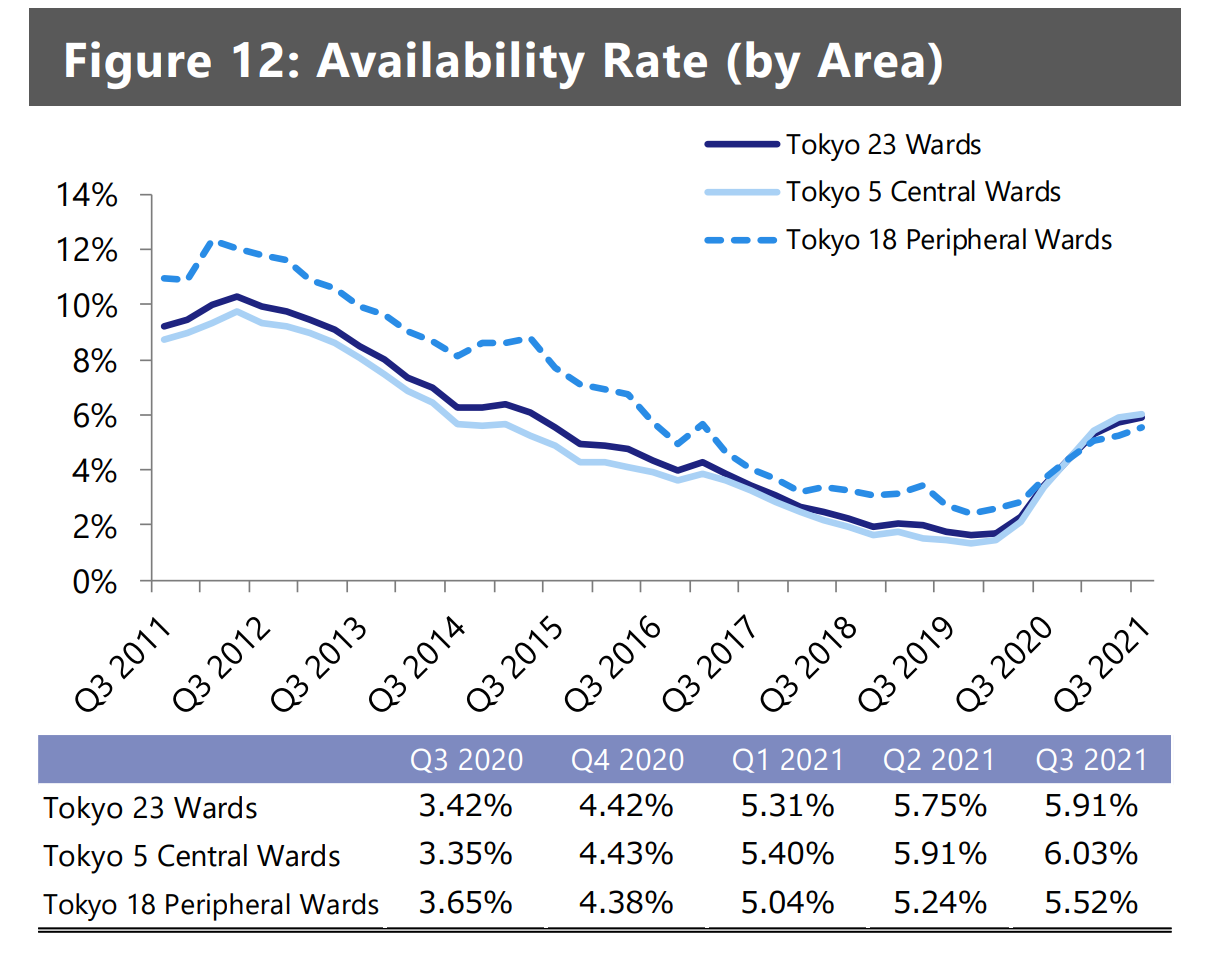
(Xymax Real Estate Institute Report)
The below two graphs depict 1) office building’s vacancy rate of 5 major metropolitan cities (left) and 2) vacancy rate comparison of three markets – US, London and Tokyo (right)
1) Vacancy rate has been increasing since 12/19 in Tokyo as the space availability picked up, but
2) Tokyo’s vacancy rates are substantially lower than those of US and London
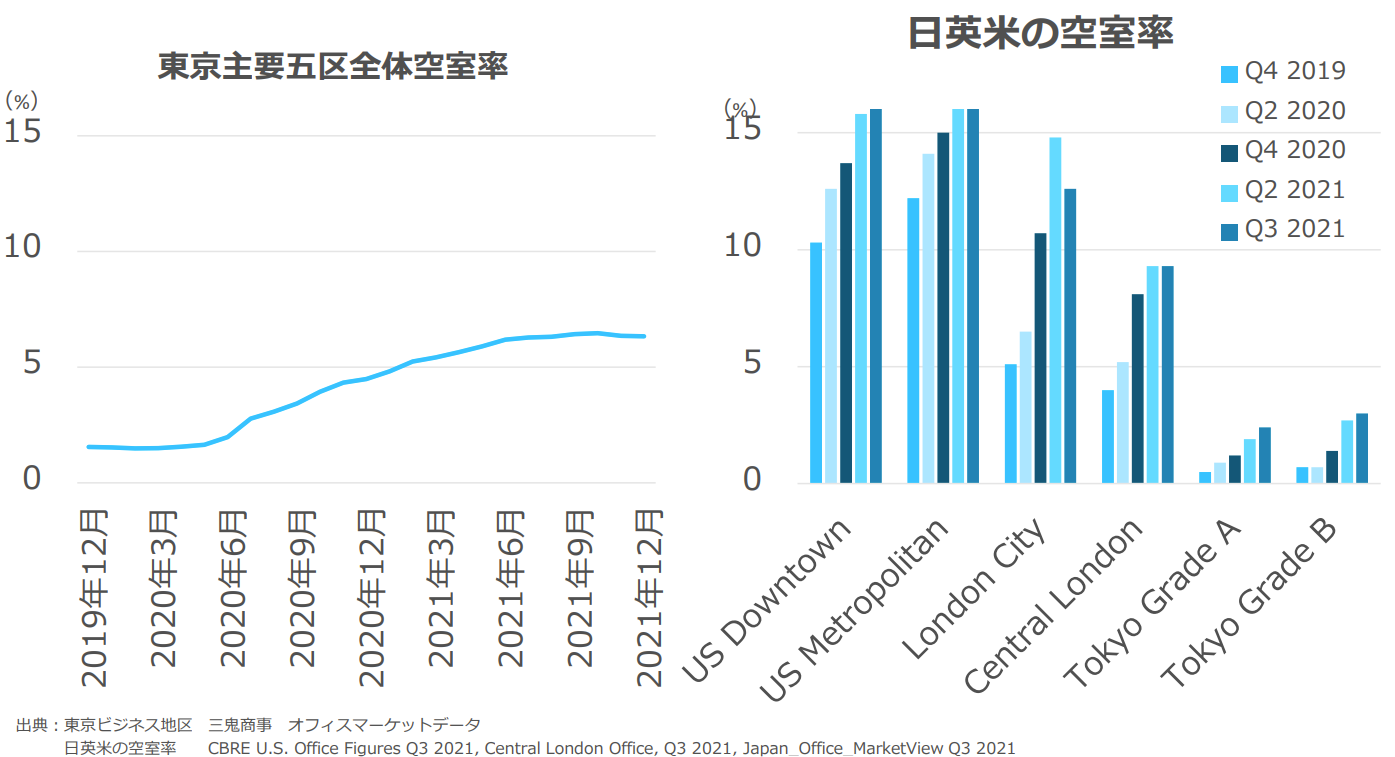
(Source: Miki Shouji, CBRE US and London office, taken from Loadstar Financial Briefing for FY 2021)
The below investment transaction bar graph shows investment amounts in 2021 may fall below that of 2020 since volume was low in Q1 but the volume had increased in Q2 and Q3.
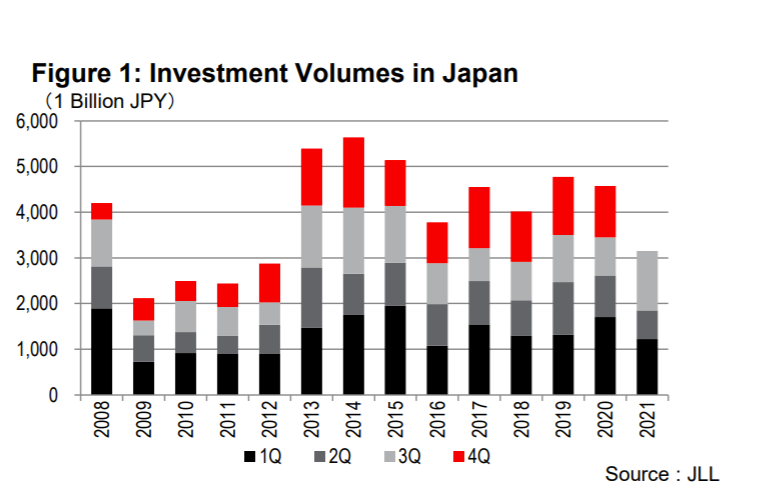
(Source: Japan Capital Flows 2021/Nov. 2021)
In terms of global city ranking by investment volumes, Tokyo ranked 4th during Jan – Sep period at $19.1 Bn.
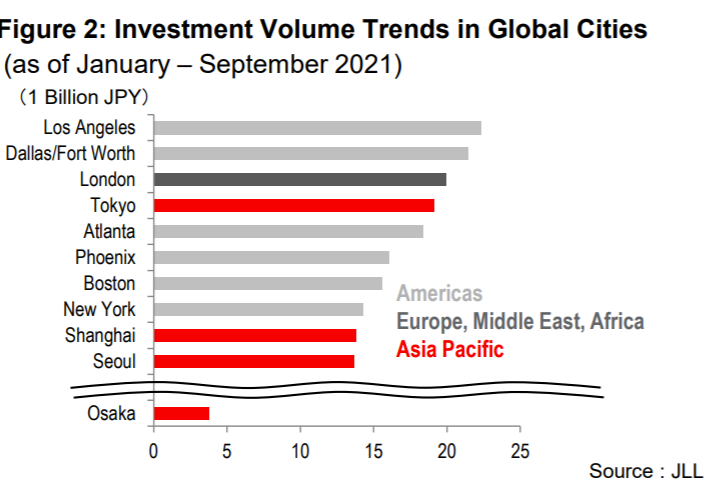
(Source: Japan Capital Flows 2021/Nov. 2021)
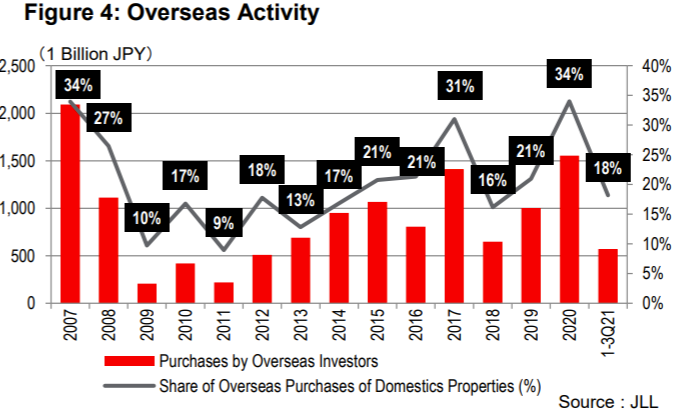
Overseas capital inflow in Japanese commercial markets was 34% of total property transaction in 2020, highest in 13 years. The share for the first 3 quarters in 2021 was 18%, still a high number.
IN SUMMARY:
Tokyo office market still enjoys relatively low supply and low vacancy rates. The global investors are still flush with cash, thanks to governments’ accommodative monetary policy in the last two years. It is likely that industry backdrop will be supportive for Loadstar for a while.
2. Loadstar’s Competitive Advantages
The below competitive edges enable the company to take full advantage of positive industry back drop:
a) The company can handle “difficult-to-get-financed” properties, such as long-unoccupied buildings, old buildings and properties with multiple owners. Based on its track record and established relationships with lenders, Loadstar get funding or these “challenging” properties.
In addition, the company can enhance profitability by 1)first acquiring these difficult properties which tend to be sold at discounts and 2) selling them AFTER “valuing them up” (ex. Locating good tenants and simplifying complicated ownership structure).
Business Model section discusses Loadstar’s strengths in more details.
3. Investor friendly management
I have been impressed with their very responsive IR team which is a reflection of management’s efforts to educate investors re: growth potential of Loadstar. CEO, Mr. Iwano (20% owner) is very active in promoting the company on YouTube and written media.
The management’s focus on shareholders are also evident in:
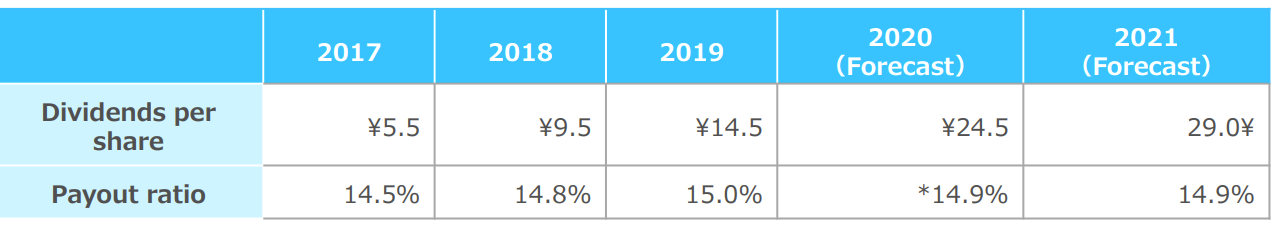
1) The target dividend payout ratio is around 15% (see below historical and planned payouts)
2) Share-buyback plan of 1,500,000 shares (9% of outstanding shares) is announced to be executed for 1/24/22 – 4/30/22.
3) Special “OwnersBook” offering allotment to Loadstar shareholders who have owned at least 1,000 shares for at least 6 months.
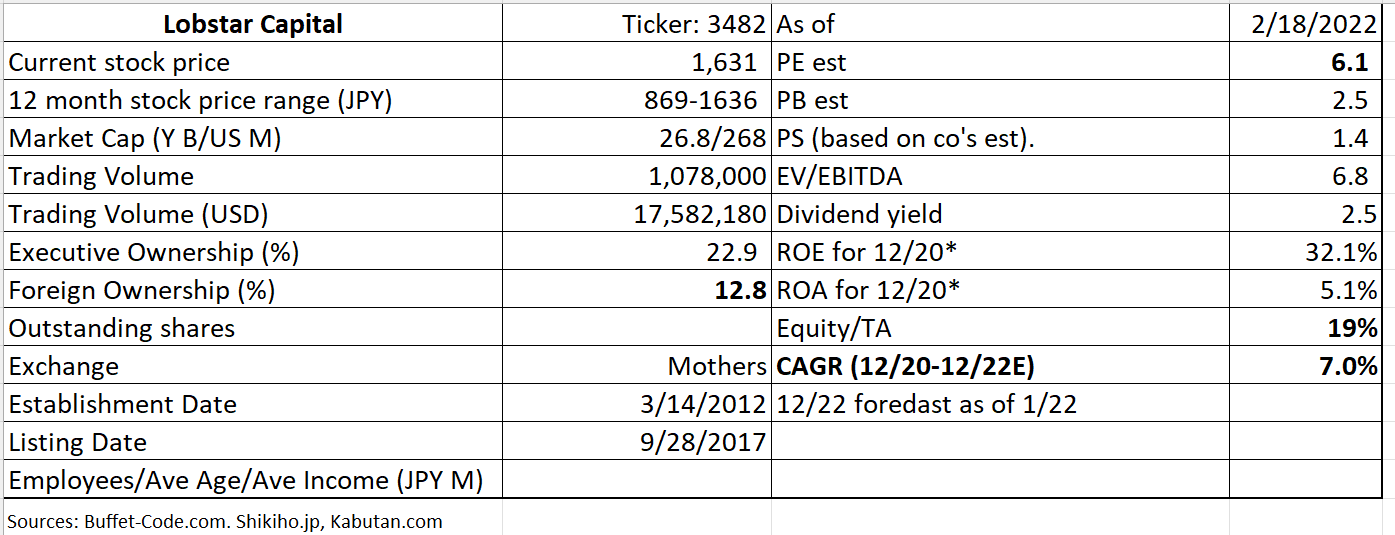
2. Valuation
The stock is trading at PE 2022E of 6.1x. This can be justified given sales growth rate (CAGR) of 7% for 12/19-22/20 E. However, we can argue that the company, with a 27% of estimated net earnings growth, can command a higher multiple. As a reference, Aoyama Zaisan Networks which is specialized in consultation on real estate investment is trading at 16.3x for FYE 12/22 expected growth of 10%.
3. Business Models
The below diagram shows that the company has 4 main segments. Loadstar’s future growth will be driven by mainly Corporate Funding and Crowdfunding which this section focuses. 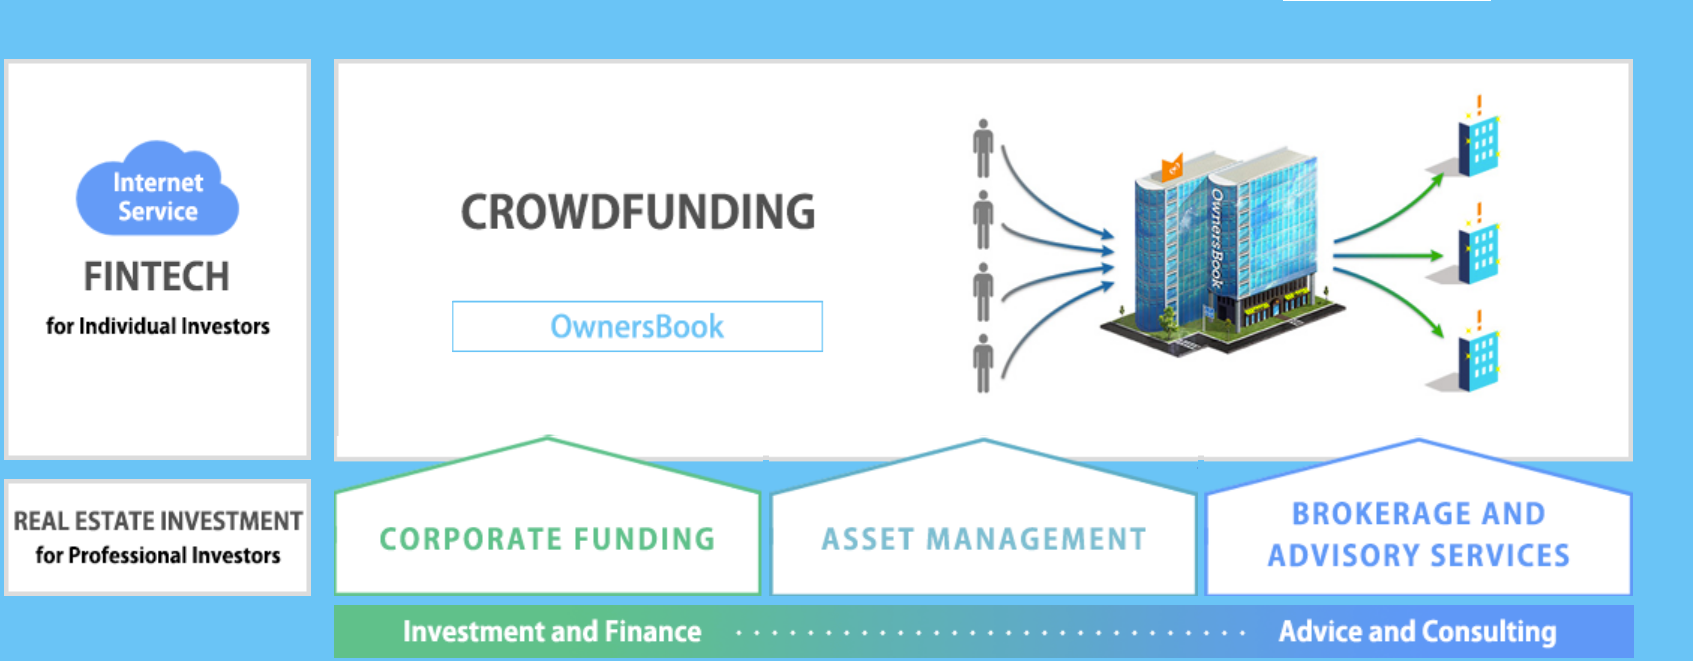
(Source: Q2 Financial Results Briefing for the Fiscal Year Ending 12/21)
Brokerage and Advisory Services and asset management business account for 13.9% of total sales. Brokerage business helps the clients in earnings great returns by providing market insights. In asset management business, Loadstar manages properties on behalf of clients.
1) Corporate funding (84% of total sales):
*20 years of industry expertise aided by 1) extensive business network and 2) AI real estate checker program which allows the company to make swift decisions re: buy/sell/lease in an increasingly tight market.
* Focus on mid-sized properties which they can add the most values such as refabricating buildings and lowering regular management costs.
*Post-Covid hybrid work arrangements have less impacts on Loadstar. Its main markets are small buildings (30 tsubo/0.8431 sf) and it will not make sense for the companies to downsize further.
* Ample amounts of unrealized gains built in the owned properties enable the company to continue obtaining bank financing (see the below graph).
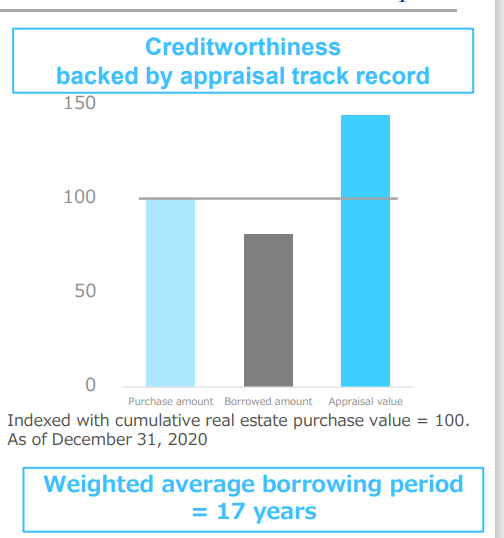
(Source: Q2 Financial Results Briefing for the Fiscal Year Ending 12/21)
2) Crowdfunding (2.1% of total sales)
This group still generates small share of sales, but management believes it will carry the company to a next growth stage.
Loadstar released OwnersBook, Japan’s first real estate crowdfunding platform in 9/14, offering retail investors an opportunity to investment in commercial properties with as little as JPY 10,000 ($100). For some projects, funding got done in 2 minutes vs a typical 1-month bank underwriting.
Two types of OwnersBook offered:
1) Loan type:
The funds invested by an unspecified number of investors through OwnersBook on the company’s site is invested in real estate mortgages.
2) Equity type:
The equity transaction in OwnersBook is an online real estate investment in which proceeds of the offering is used to purchase a real estate trust beneficial interest (together with a non-recourse loan – the above product). The rental income and profit/loss from the sale of the real estate trust beneficial interest are distributed to investors
The below diagram visualizes these two types of product offerings.
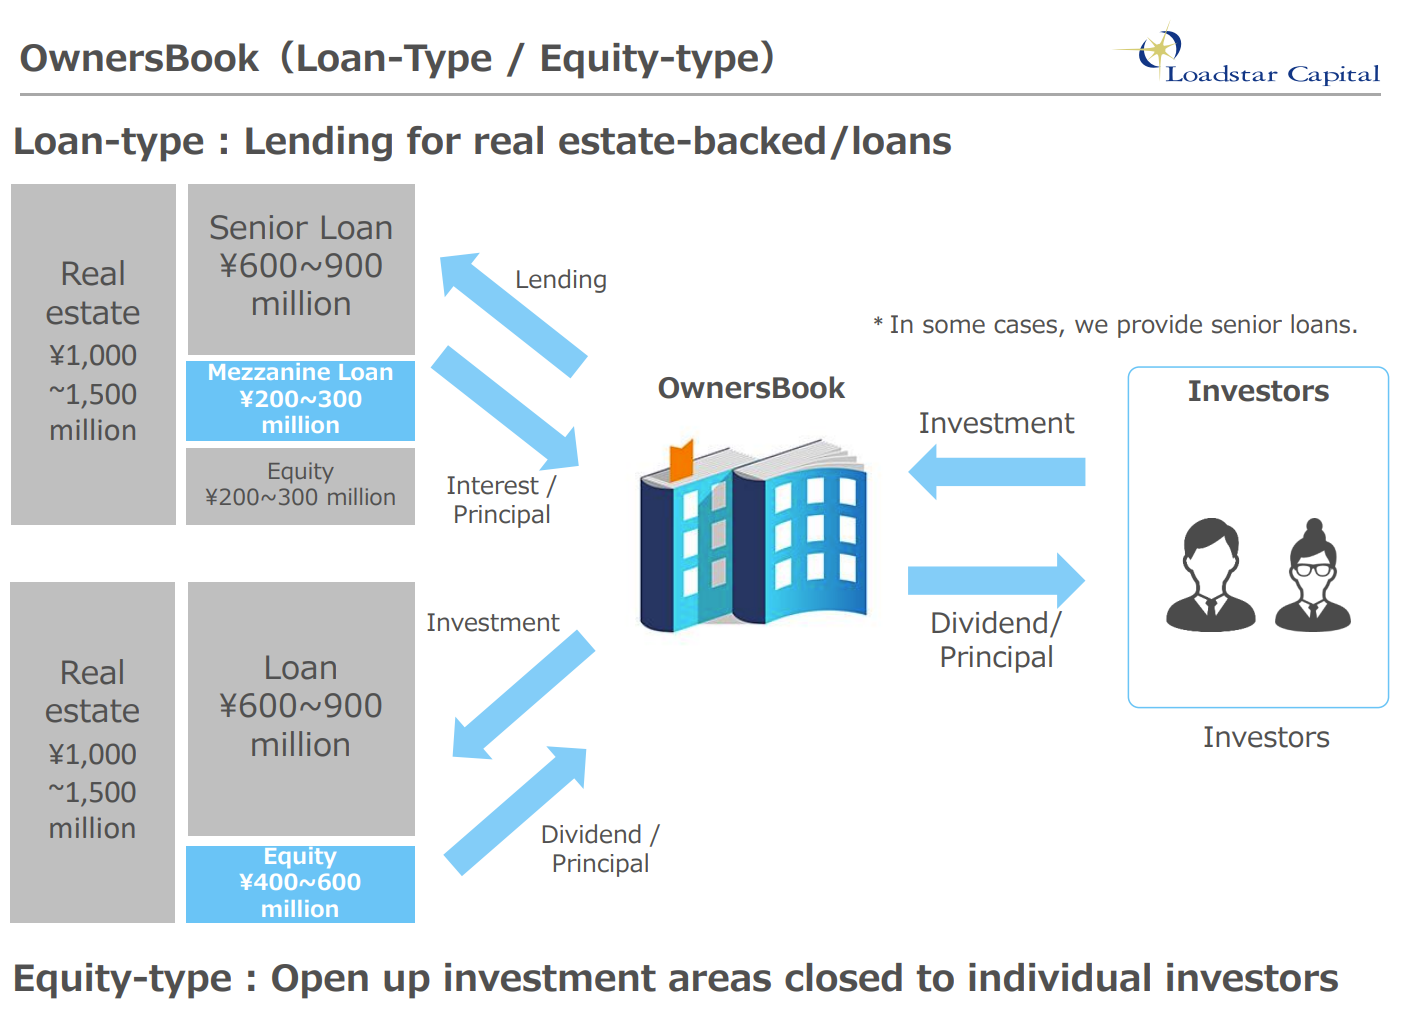
(Source: Q2 Financial Results Briefing for the Fiscal Year Ending 12/21)
Competitive edge in Crowdfunding area:
The below diagram succinctly describes the entry barrier the company enjoys:
1) first mover advantage – the company has built credibility with the retail investors,
2) the company has already went through time-consuming licensing process (money lending, investment management licenses etc. , and
3) Loadstar’s employees are a group of real estate AND IT professionals.
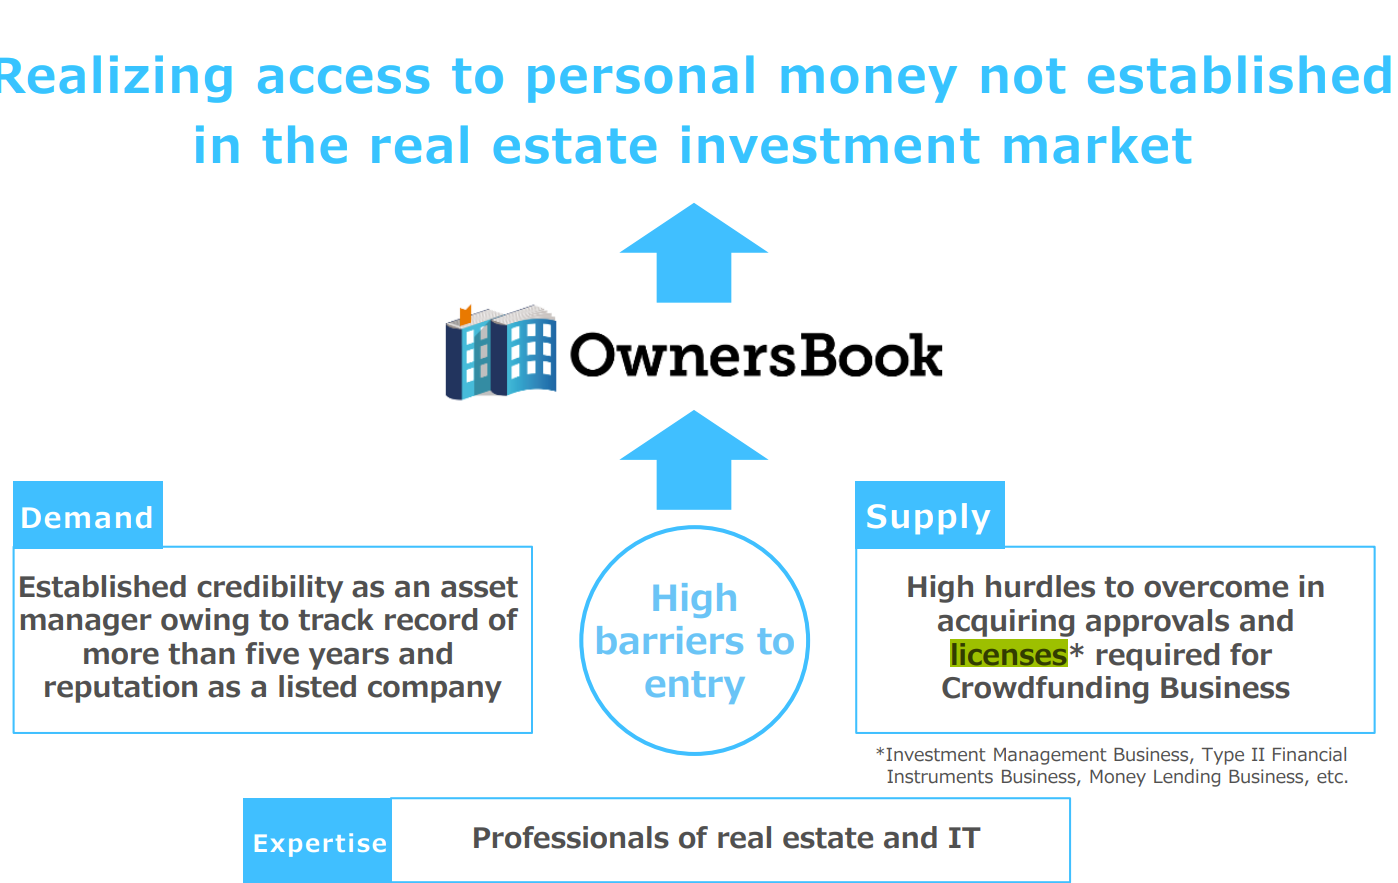
(Source: Q2 Financial Results Briefing for the Fiscal Year Ending 12/21)
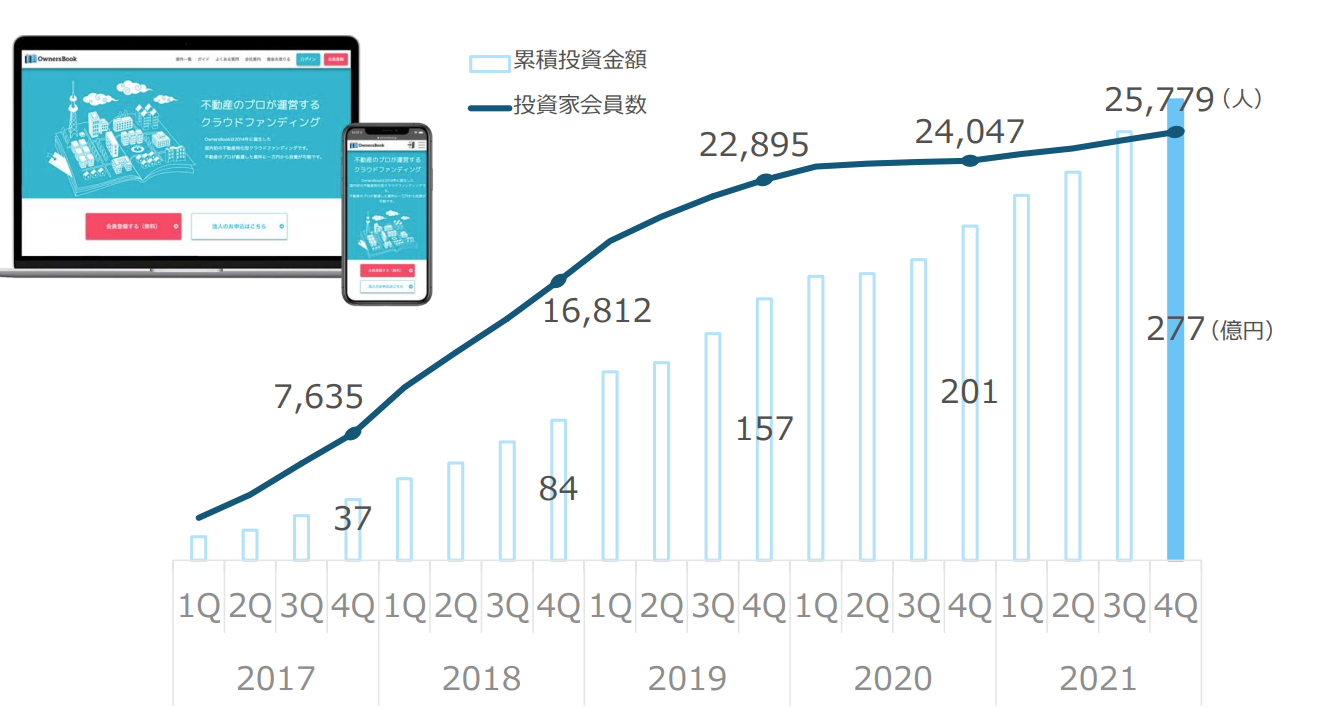
The below graph shows the steady growth of investors (line graph in number of investors) and accumulated invested amounts (bar graph, in JPY MM).
4. Financial Highlights
The company expects to enjoy a 27% rise in net income driven by:
1) Top line growth is conservatively estimated at 3%
2) The majority of growth is expected to come from profitability increase in corporate funding operations. The company has been able to “value up” the “difficult” properties which were acquired at a discount and sell them at high profitability.
3) In the asset management, the office building demand from both overseas and domestic institutional investors continue to be high, increasing fee income for Loadstar.
4) In the CrowdFunding operations, retail investors’ interests in Owners’Book remain high. The evidence: all projects attract funding within few minutes of announcements.
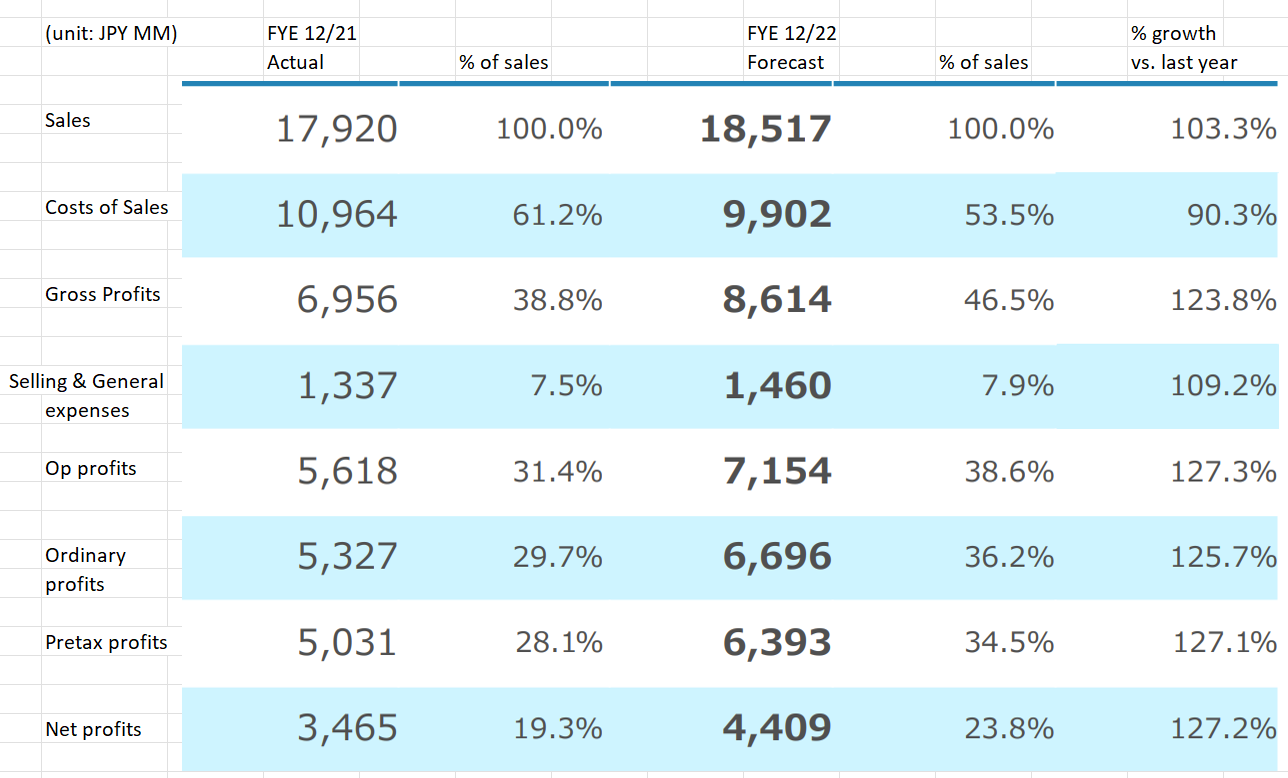
(Source: Financial Results Briefing for FYE 12/31/21)
5. TAM (Total accessible markets)
Tokyo office market expectation is discussed in the Investment Thesis section.
6. Strengths and Weaknesses
Strengths
To reiterate what are listed in Investment Thesis section, Loadstar present the below strengths:
1) Tokyo office building market is expected to continue attracting institutional investors.
2) Loadstar’s keen eyes for “profitable properties” are proven by its 20 years of track record.
3) Shareholder friendly management offers investors with steady dividends payout and share buybacks.
Weakness
Faster than expected FRB tightening.
Fed has been transparent about its intention to raise Fed Fund rates in 2022. Some economists expect 5-7 times in a year. Others expect it can raise it by 1% at 3/22 meeting. If FED tightens too soon too fact to fend off inflation, that may lead to undesirable outcome of “recession”. The recession will dampen investors’ appetite and ability to invest in Tokyo office markets.
Mitigants: Management believes that any negative market conditions will affect Loadstar less which focuses on small to mid-size properties. The slowing global economy will have more severe pricing pressure on large class A buildings.
7. Near-term Selling Pressure
As noted in useful tips section of www.JapaneesIPO.com, when the stock’s outstanding margin buy volume is high and rising, that will function as the near-term selling pressure. For Loadstar, margin buy/sell ratio for 2/10 was 3.8x, slightly high, but acceptable given its daily trading volume is 1MM shares (note: in the heading of the below table, margin buy and margin sell is reversed).
Margin trading unit (1,000):
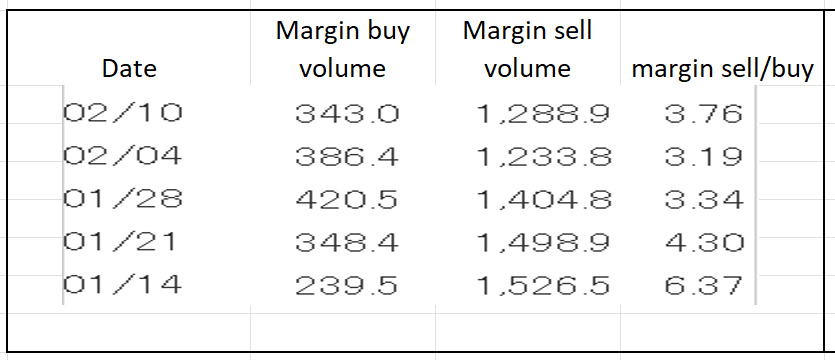
(Source: Kabutan.com)
[Disclaimer]
The opinions expressed above should not be constructed as investment advice. This commentary is not tailored to specific investment objectives. Reliance on this information for the purpose of buying the securities to which this information relates may expose a person to significant risk. The information contained in this article is not intended to make any offer, inducement, invitation or commitment to purchase, subscribe to, provide or sell any securities, service or product or to provide any recommendations on which one should rely for financial securities, investment or other advice or to take any decision. Readers are encouraged to seek individual advice from their personal, financial, legal and other advisers before making any investment or financial decisions or purchasing any financial, securities or investment related service or product. Information provided, whether charts or any other statements regarding market, real estate or other financial information, is obtained from sources which we and our suppliers believe reliable, but we do not warrant or guarantee the timeliness or accuracy of this information. Nothing in this commentary should be interpreted to state or imply that past results are an indication of future performance