(please note that the tables in the report are available to the clients)
Happinet Corp (HC) is a leading intermediary distributor for toys, DVDs, Blu-Ray discs, CDs, videogames, and products for amusement facilities. The company buys goods from makers and distributes them to retailers, managing inventories and handling orders/shipments. Segments comprise Toys (42.8% of sales in FY03/24), Visual and Music (18.5%), Videogames (26.8%), and Amusement (11.9%). HC boasts the highest market share for capsule toy machine sales at about 60%, according to the company.
I would like to start by discussing the weaknesses and challenges that often come to mind for investors when evaluating the Japanese toy industry. I outline the company’s strengths later, so please read through to the end.
1. A declining child population which is the main users of toys.
Even with the challenges of a shrinking young population, Japan’s toy market hit an impressive milestone in 2023, reaching the trillion yen mark for the first time.
How?
1) Kidults and a rising spent/buyer
To keep the toy industry exciting, manufacturers tap into media trends, tech innovations, and pop culture, offering everything from classic toys to high-tech gadgets that appeal to both kids and adults. As birth rates drop, toy makers focus on “kidults” – adults who enjoy hobbies like collecting trading cards, a major player in the toy business.
The market for 10 toy categories grew from ¥447.6 billion in 2013 to ¥688.3 billion in 2023, averaging a 4.4% annual increase. When calculating the average spending per child (0-14 years), the figure rose from ¥27,310 in 2013 to ¥48,570 in 2023, reflecting a CAGR of 5.9%. This growth highlights increased spending per child, driven by high-end collectibles and advanced toys.
2) New category: capsule toys to boost toy demand
The global demand for capsule toys, dispensed through vending machines (commonly known as gashapon in Japan), has been growing steadily due to their appeal as collectible and novelty items for both children and adults. Here are the key insights:
Market Size and Growth
The global capsule toy market was valued at over $2 billion in 2023 and is expected to reach nearly $3 billion by 2025, growing at a CAGR of around 10%.
The capsule toy vending machine market specifically was valued at $351 million in 2024 and is projected to grow to $635.8 million by 2030, with a CAGR of 10.4%.
Regional Insights
Japan: The largest market globally, generating over $1.8 billion annually from more than 3 billion capsule toys sold each year. Japanese gashapon machines are renowned for their high-quality, collectible toys.
China: A rapidly growing market with over 80,000 machines generating ¥2 billion ($300 million) in annual revenue as of 2023.
United States: The U.S. market generated over $250 million in revenue in 2021 and is projected to exceed $400 million by 2025.
Europe: Germany and the UK lead the European market, with revenues of €120 million and €80 million, respectively, in 2022. Customized capsule toys based on local culture drive demand.
Asia-Pacific: The fastest-growing region due to urbanization, rising disposable incomes, and a strong vending machine culture.
Factors Driving Demand
Collectibles Culture: Capsule toys are increasingly sought after by collectors, with limited-edition items often resold at high premiums on platforms like eBay.
Technological Advancements: Features like mobile payments, touchscreen interfaces, and interactive designs enhance consumer engagement.
Youth Appeal: Younger consumers drive demand for affordable novelty items, particularly in urbanized regions.
Brand Collaborations: Partnerships with popular franchises (e.g., anime or movie IPs) boost the appeal of capsule toys globally.
Emerging Trends
The rise of premium capsule toys sold at higher price points on high-end commercial streets in Europe and Asia.
Increasing adoption of vending machines in non-traditional markets like the Middle East and Africa due to urbanization and entertainment tourism.
Bottom line:
The capsule toy market’s growth is fueled by its blend of affordability, collectability, and technological innovation, making it a dynamic segment within the global retail and entertainment industries.
2. Managing Earnings Volatility: Strategies to Navigate Successes and Misses.
The below table reveals the company’s sales and profit volatility:
Analyzing historical sales data reveals that the company’s performance heavily depends on the availability of hit products each year.
This reliance, however, is partially balanced by the company’s strategy of working with a diverse network of vendors, which helps mitigate potential risks.
The company, as a distributor with established relationships across various brands, experiences reduced earnings volatility. Its diverse portfolio includes toys, video games, and movies from major manufacturers and studios.
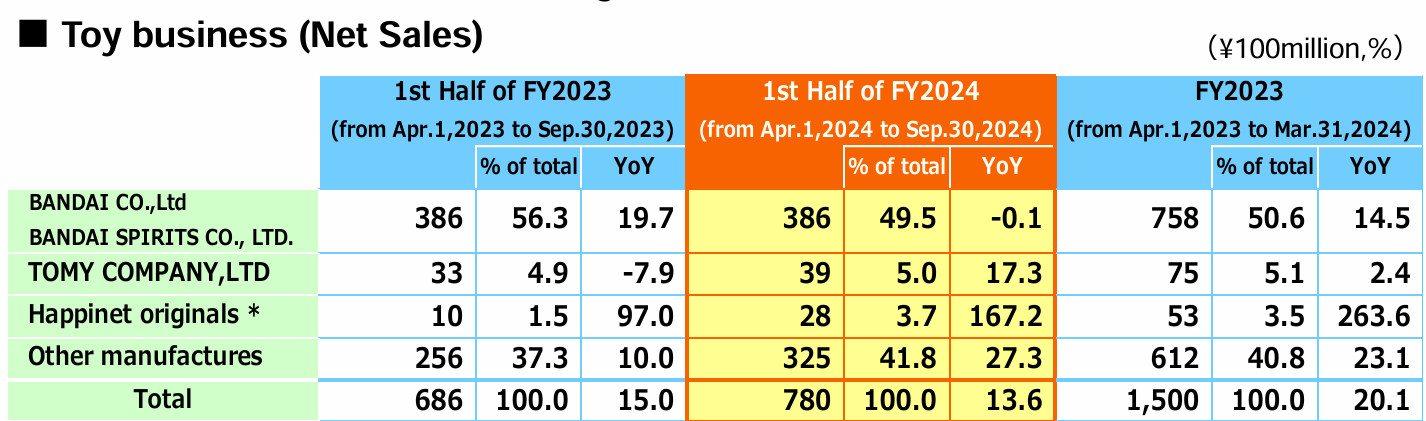
In the toy segment, while 50% of sales come from Bandai and 5% from Tomy Co., over 40% are generated from other manufacturers. This includes popular items like Pokémon trading cards.
In video games, the company distributes titles from industry giants such as Sony Interactive Entertainment and Nintendo. For movies, it secures rights to show films from major U.S. studios like Paramount and Warner Bros.
By handling major titles across sectors, the company mitigates much of the inherent volatility from new release performance, though not entirely eliminating it.
(source: company)
An interesting comp is with makers of products that HC distributes.
Table available to the clients
These manufacturers focus on their own products, which would typically result in higher volatility and, consequently, lower valuations. However, their valuations are higher than HC’s. This is likely because the companies on this list are well-established and have demonstrated their ability to release new, well-received, next-generation products. For example, Nintendo’s shares are up by around 60%, despite its operating profit likely decreasing by 40% for FY25. This is due to investors’ confidence in Nintendo’s ability to release the new Switch, which is expected to perform well, as well as the enduring success of its flagship “Switch” console, which currently sits between product generations.
3. Low Margin:
Happinet’s profit margin appears to be relatively low due to several factors inherent to its business model and industry.
Intermediary distributor role:
Happinet primarily operates as a middleman between manufacturers and retailers in the entertainment products industry. This business model typically involves thin margins due to the competitive nature of distribution.
High-volume, low-margin strategy:
As a distributor of toys, DVDs, Blu-Ray discs, CDs, videogames, and amusement facility products, Happinet likely focuses on high sales volumes with lower profit margins to remain competitive.
Inventory management costs:
Managing inventories for a wide range of products across multiple categories can lead to increased operational costs, potentially impacting overall profitability.
Market pressures: The company operates in a market with strong bargaining power from both suppliers (manufacturers) and customers (retailers), which can squeeze profit margins.
Despite these challenges, it’s worth noting that Happinet has been showing some positive margin trends:

(source: company)
The above table highlights the positive impacts of the higher-margin segments: Toy and Amusement. Operating profit margin, excluding corporate-wide expenses, increased from 3.3% in the first nine months of FY3/24 to 3.9% in the first nine months of FY3/25. Notably, the amusement segment experienced 37% year-over-year growth, driven by strong product momentum in major items like capsule toys, suggesting further improvement in operating profit margin is likely.
Now about HC’s strengths:
1. Earning momentum
We need to pay attention to a company that increases its guidance in 6 months.
Increased guidance for 6 mos/FY 3/25, issued in 8/24
New forecast vs. Original forecast (3/24)
Sales: Y 165,000 MM vs. 150,000 MM +10%
OP: Y 3,800 MM vs. 6,000 MM + 57.9%
Reasons for the upside: the strong performance of trading cards such as the ‘Pokémon Trading Card Game’ and the ‘ONE PIECE Trading Card Game’ in the toy business, as well as the expansion of capsule toy shop ‘Gashacoco’ outlets operated by HC.
The company conservatively did not change the full-year guidance for FY3/25 due to uncertainty on the upcoming Christmas and year-end/New Year sales season, which is the group’s biggest earning season.
Increased guidance for the full year FY 3/25, issued in 2/25
New forecast vs. revised forecast (8/24)
Sales: Y 360,000 MM vs. Y330,000 MM +9.1%
OP: Y 11,100 MM vs. Y7,800 MM + 42.3%
Reasons for the upside: The continued strong performance of the toy and amusement businesses.
The company recorded an extraordinary loss of Y1.351 Bn (impairment costs for software related to game applications). Thus, the net income increase was less at +32% to Y6,600 MM.
Dividend guidance increase
HC’s dividend policy is to maintain a stable annual dividend of Y 50 yen with a target dividend payout ratio of 40%.
The new dividend payout for FY 3/25: Y130/share vs. Y125 last year.
2. Beneficiary of inbound demand
Sales of toys in airport shops increased by 160% compared to the previous year (April-September 2023 vs. April-September 2024), with products using IPs like “Mario” and “Pokémon” performing well. Additionally, capsule toy sales at Narita Airport reached 138% compared to the same period last year. This inbound demand is thought to be driving market expansion.
3. Trading card game sales increased by 630% over 5 years
4. Limited competition among the large-scale toy distributors: the nearest peer, Kawada, is not as diversified as HC.
Disclaimer
The opinions expressed above should not be constructed as investment advice. This commentary is not tailored to specific investment objectives. Reliance on this information for the purpose of buying the securities to which this information relates may expose a person to significant risk. The information contained in this article is not intended to make any offer, inducement, invitation or commitment to purchase, subscribe to, provide or sell any securities, service or product or to provide any recommendations on which one should rely for financial securities, investment or other advice or to take any decision. Readers are encouraged to seek individual advice from their personal, financial, legal and other advisers before making any investment or financial decisions or purchasing any financial, securities or investment-related service or product. Information provided, whether charts or any other statements regarding market, real estate, or other financial information, is obtained from sources that we and our suppliers believe are reliable, but we do not warrant or guarantee the timeliness or accuracy of this information. Nothing in this commentary should be interpreted to state or imply that past results are an indication of future performance.