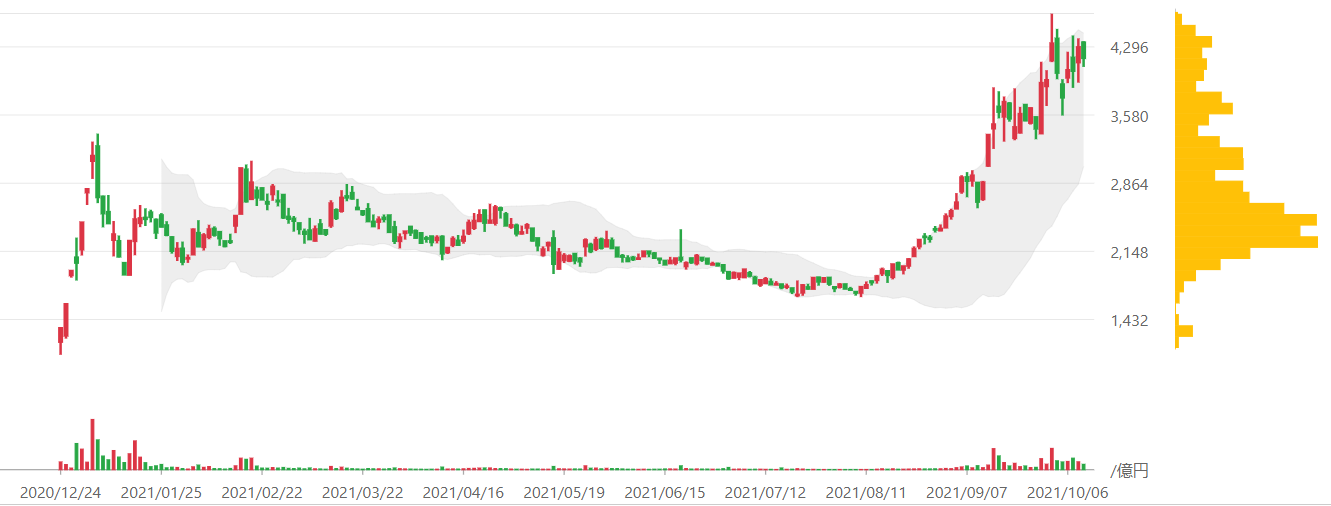
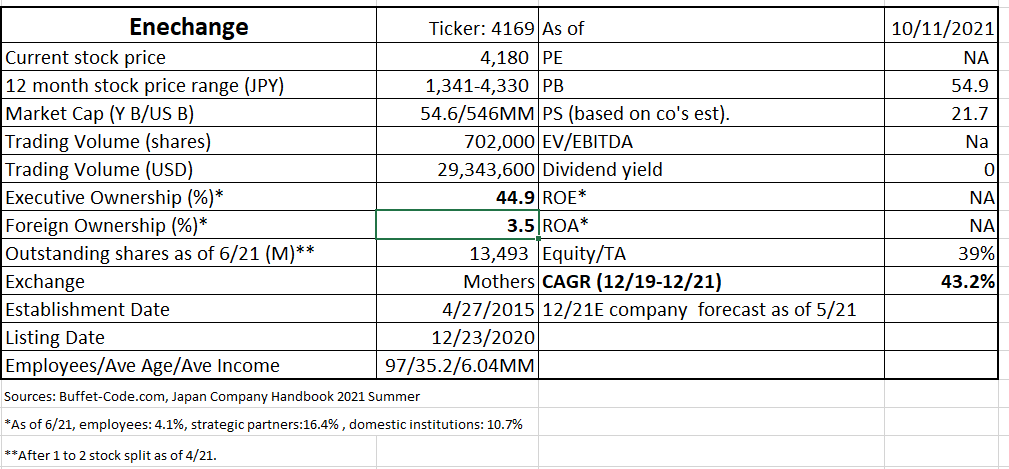
ENECHANGE Ltd. (4169): killing five birds with one stone – As an Energy SaaSer, Enechange is one stock hitting two major investment themes: (1) ENERGY 4Ds (Decarbonation, Digitization, Decarbonation and Decentralization) and (2) SaaS (Recurring Revenues). Stock price may be range-bound for a while. But if the stock can maintain a high trading volume, the stock can appreciate further.
(Source: Beffet-code.com)
1. The social challenge which the company is solving:
As the only publicly traded energy tech company, ENECHANGE (the “Company” or “ENE”) is proving a cost-effective solution for the decarbonation mandate in Japan.
Japan’s electric industry – CliffsNotes:
Japan has introduced a phased reregulation of its power retail markets, based on an amendment of the Electric Utility Industry Law in 1995. In 1995, IPP (independent power producer) was allowed to sell power to the electric utility. From 2000, liberation was applied based on the customer usage: large companies with 2000kW usage (2000), companies with 500 kW (2004), and entities with 50kW (2005). In 4/2016, regulations have finally reached consumer households.
In addition, total electricity deregulation went into force on 4/1/16 which has allowed new entrants (outside of traditional 10 largest electric utility) to provide electricity to consumers. Major new entrants have so far consisted of large gas companies (Tokyo Gas, Osaka Gas) and large telcos (KDDI, Softbank).
In order to achieve net zero by 2050 required by international agreements, major shift in energy mix needs to happen (see below diagram prepared by ENE). In Japan, renewable energy is not a cheap energy source, and supported by a subsidy called renewable energy levies. The below renewable energy targets are ambitions and requires subsidies (e.g., FIT*) to grow to JPY 6 Tn, supported by a rise in renewable energy levies on energy bills. In other words, household electricity bills will most likely grow by about 10% to 20%. Thus, there will be more demand for switching electricity contracts, energy-saving and VPP**services. The consumers’ desire to reduce electricity bills by switching to the most cost-efficient contracts are the major trail wind to ENE’s revenue growth.
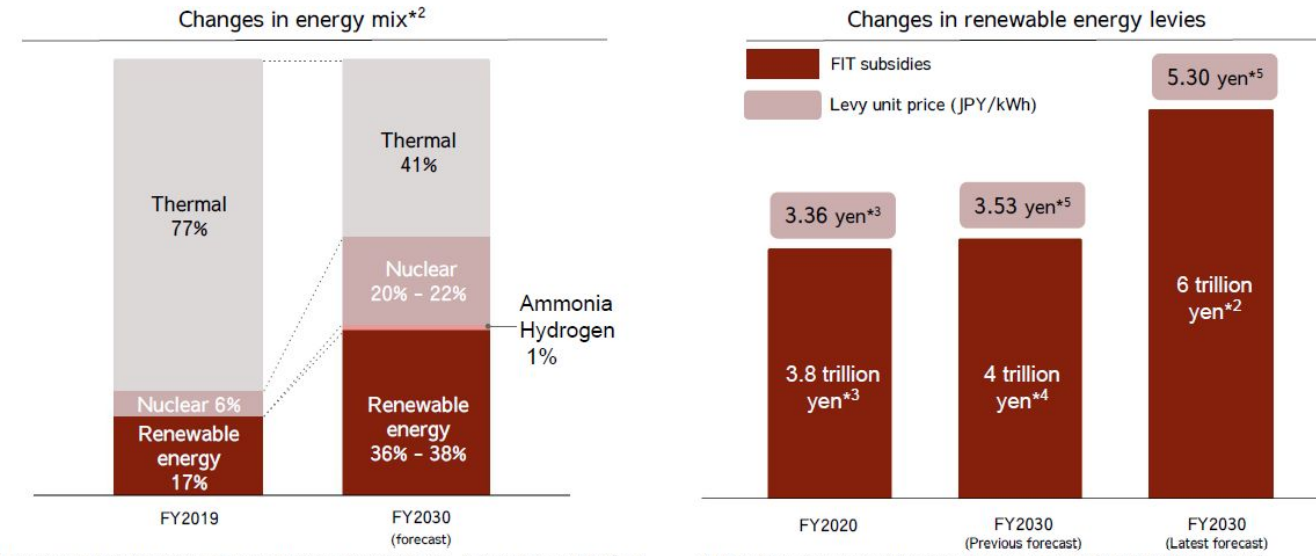
*FIT: Feed-in Tariffs
**VPP= Virtual Power Plant: the owner of a power generation or storage facility directly connected to the electricity grid controls its energy resources to provide the same functionality as a power plant.
(Source: The Company’s earnings presentation for Q2 2021).
The decarbonization will also lead to the rise of the electricity market which is expected to grow from the current JPY 13 Tn to JPY 18 Tn by 2050 (based on METI***)
*** METI: Ministry of International Trade and Industry
2. Investment Thesis:
Investment in ENECHANGE is a calculated bet on the company’s Cambridge educated CEO, Mr. Yohei Kiguchi. His confidence in his company’s growth potential permeates through his speech and well -prepared presentation materials. His confidence is solidified by his experience in founding and running his energy start up in UK, “SMAP Energy Limited“. His shareholder focus is particularly evident in a page of presentation which market capitalization of the stocks of his European and US counterparts (discussed later Investment Strengths section.) His point: These companies are similar in business model but far ahead in terms of the energy industry penetration and market capitalization ENE’s share price should grow to narrow valuation gap as the company’s presence and visibility increases.
Mr. Kisuchi has good supports from his management team as, executive ownership of ENE shares is high at 45%. His ability to communicate with shareholder base should lead to multiple expansion.
The below is the summary’s ENE’s accomplishments for Q2 2021. Are you interested?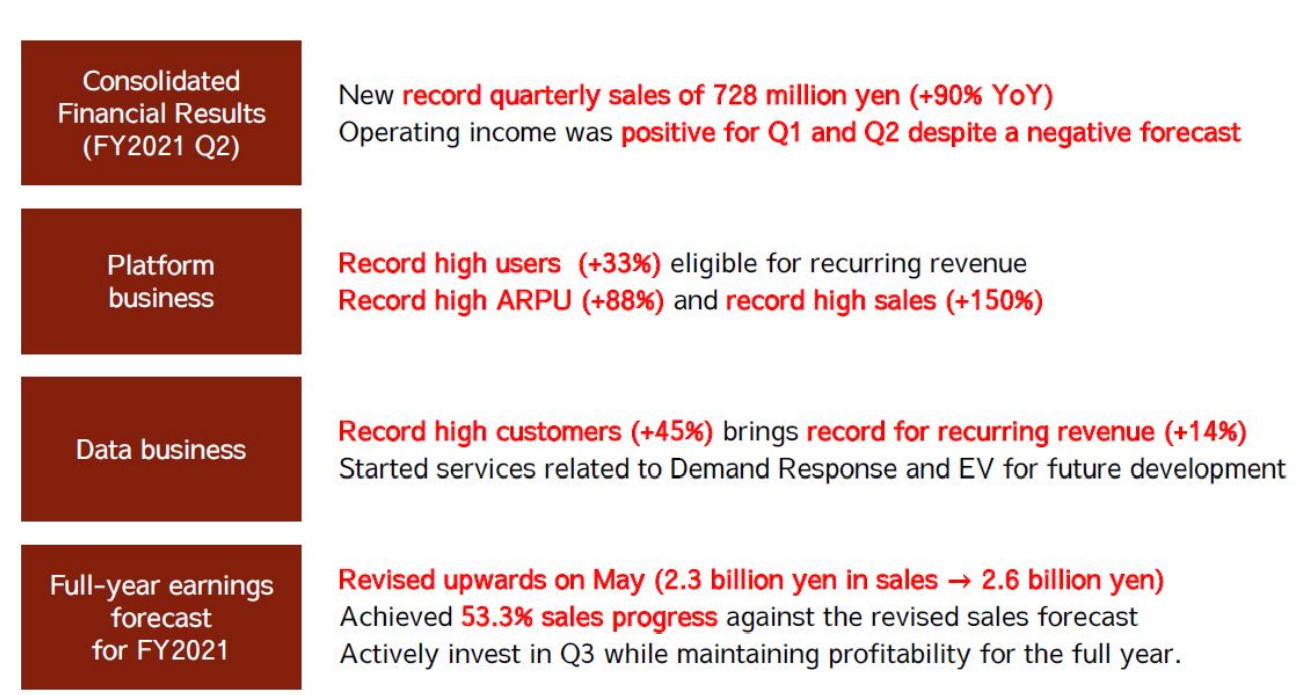
(Source: The Company’s earnings presentation for Q2 2021).
3. Business Summary:
The Company operates electricity gas switching platform, “ENECHANGE”, which allows comparative review of energy providers based on fee structures, power configurations and CO2 emissions.
The current sales driver is monthly charges equaling to a fixed portion of monthly usage fees paid by consumers who switched electricity as suppliers with “ENECHANGE”, until a retail supply agreement expires. The number of households continuously paying the fees was around 240,000 as the end of December 2020.
The next stage growth pillar is the tools for marketing and data analysis to electricity gas firms on a monthly change-based SaaS model.
4. Business Model:
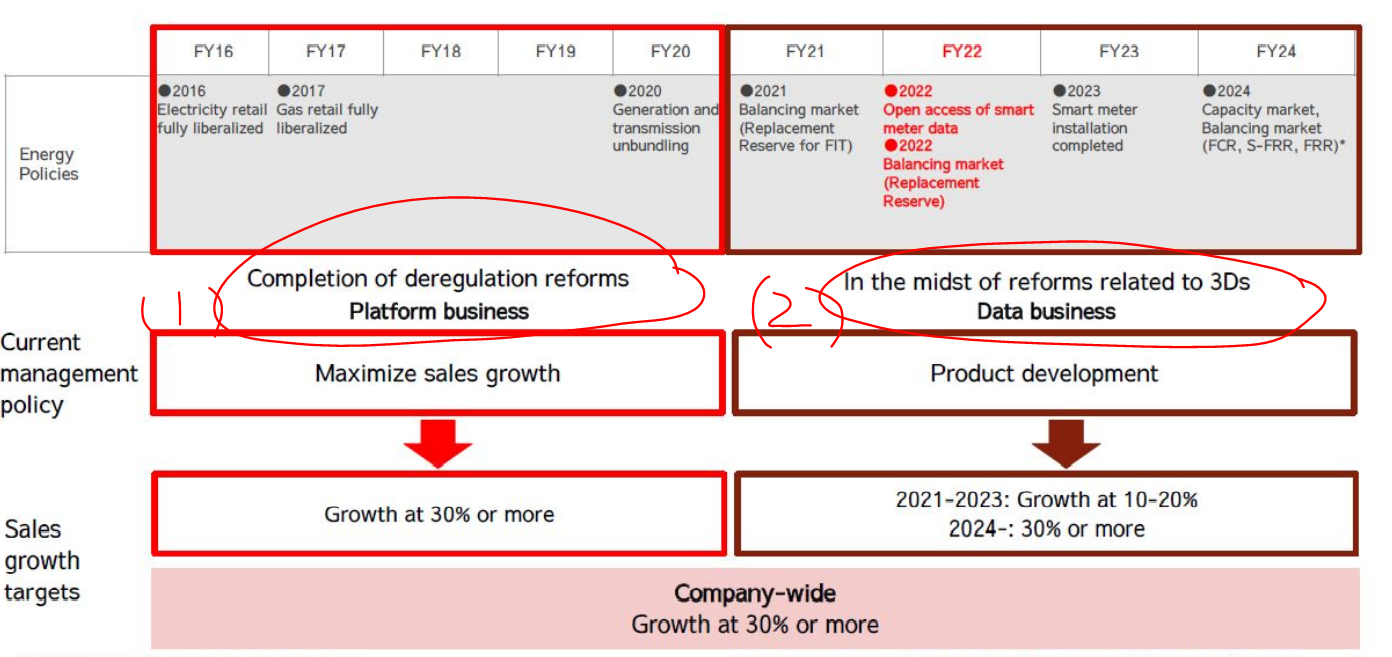
The below diagram highlights the way ENE segments its two groups based on Japan’s aforementioned energy deregulation reform which runs through from year 2016 through 2024.
1. Platform business benefits from completion of deregulation reforms and is in the phase which allow for the company to reap steady sales growth of 30% (left red circle in the below diagram. Sorry that I can’t circle better).
(Source: the Company’s earnings presentation for Q2 2021).
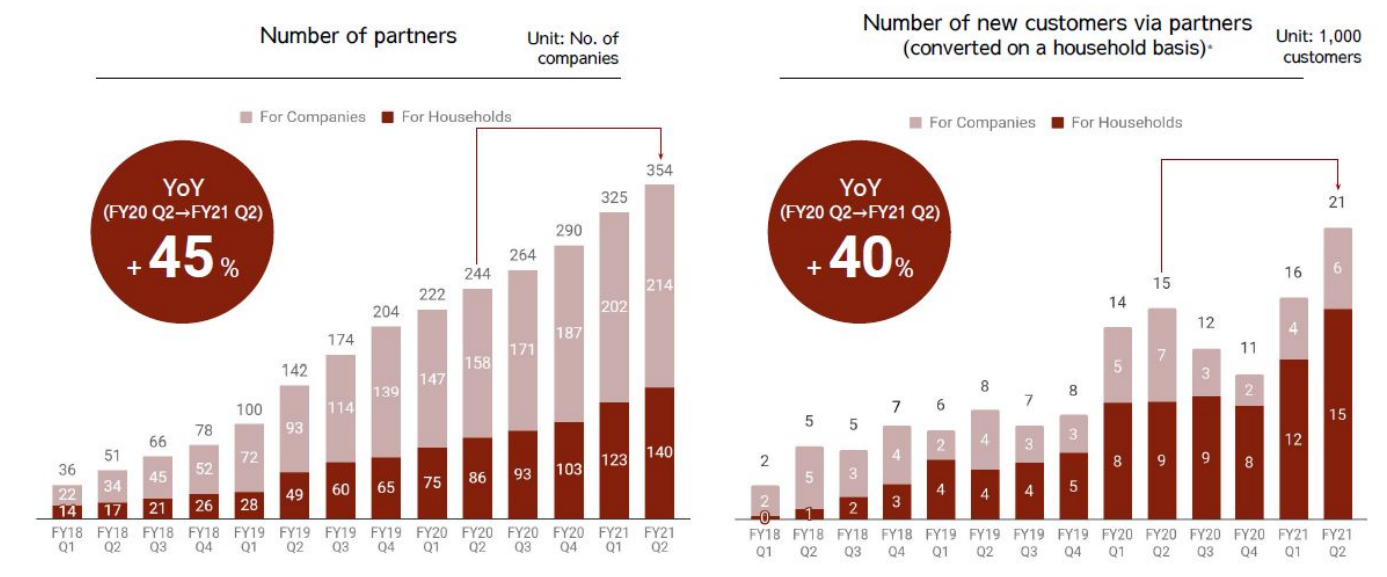
In the platform operations, the company has emphasized the partnership strategy and provided electricity/gas switching platform system to real estate companies and financial institutions (“partners” in the below graphs. At the end of Q2 21, the company has 354 partner companies (+45% y/y) and the number of customers gained through partners rose 40% y/y.
 (Source: The Company’s earnings presentation for Q2 2021).
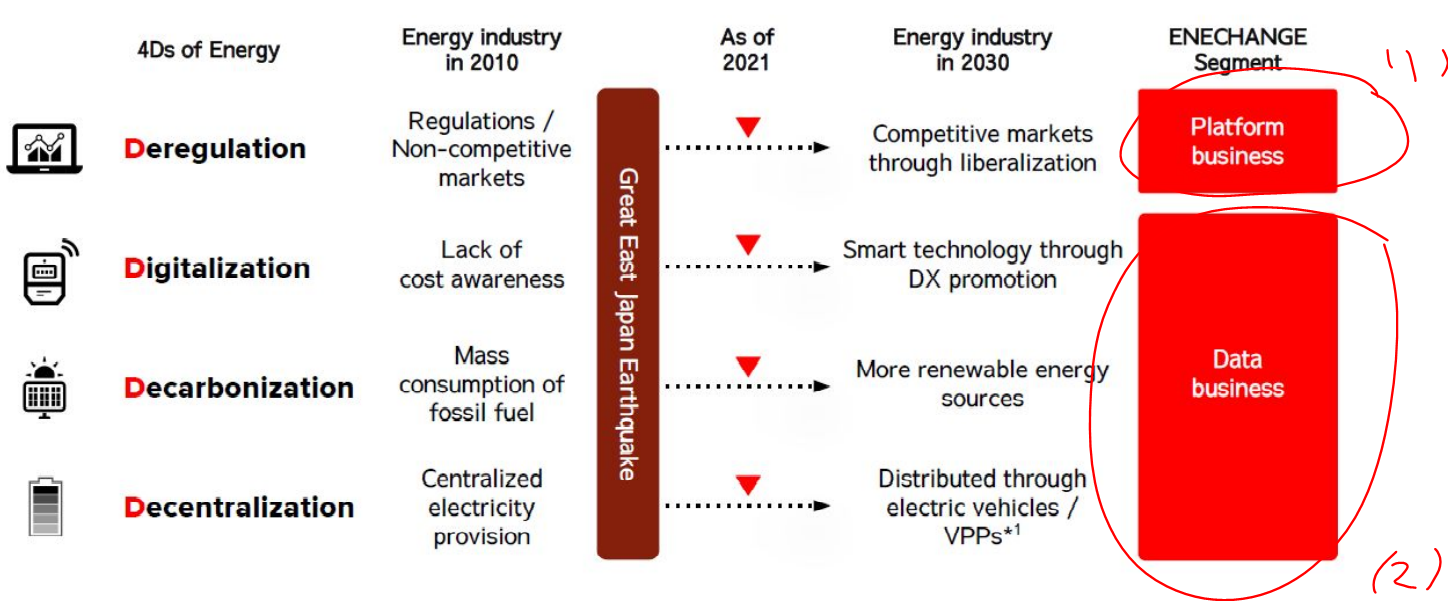
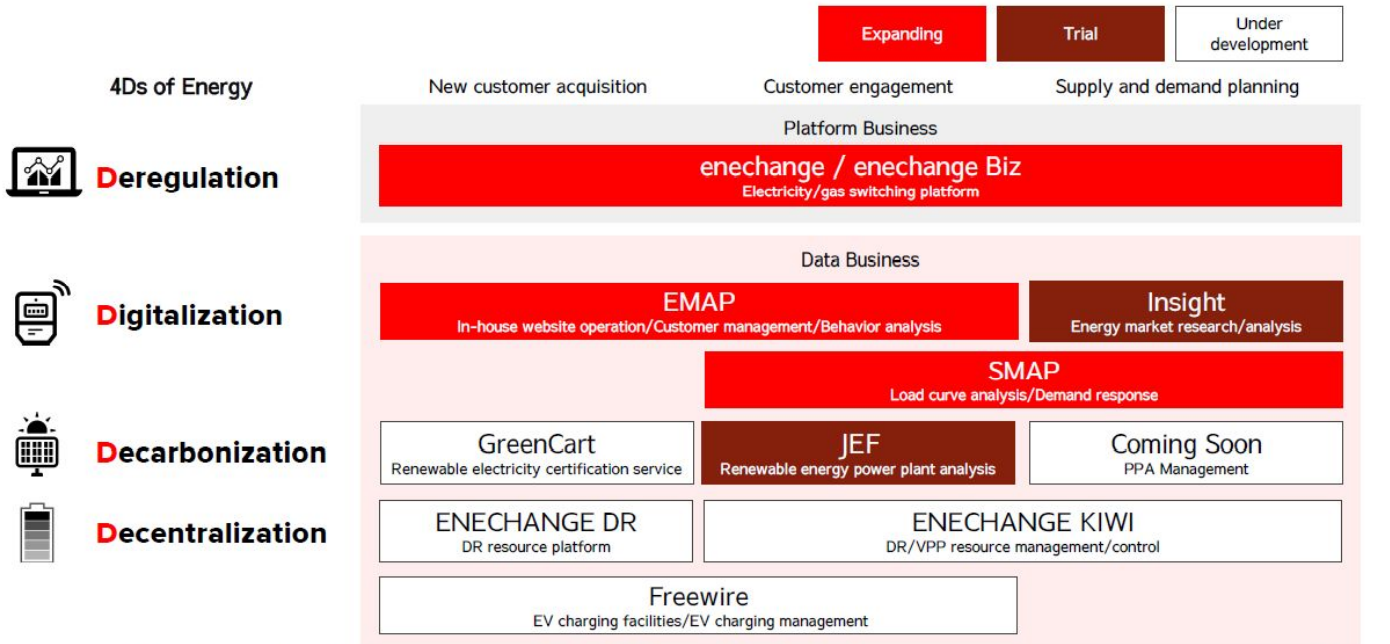
2. Data business addresses the 3Ds of energy
Database business (shown in right red circle in 2 diagrams above) addresses the 3Ds out of 4Ds of Energy: Digitization, Decarbonization, Decentralization. The 1st D is handled by Platform business.
(Source: the Company’s earnings presentation for Q2 2021).
*VPP= Virtual Power Plant: the owner or a power generation or storage facility directly connected to the electricity grid controls its energy resources to provide the same functionality as a power plant.
Two Segments in details
1. Platform business offers two product types: “Enechange” and “Enechange Biz”
Enechange: For household (average annual savings for 4-member individual households $385 based on average number of top 3 utility client companies)
Enechange Biz: For entities (average 15% cost reduction).
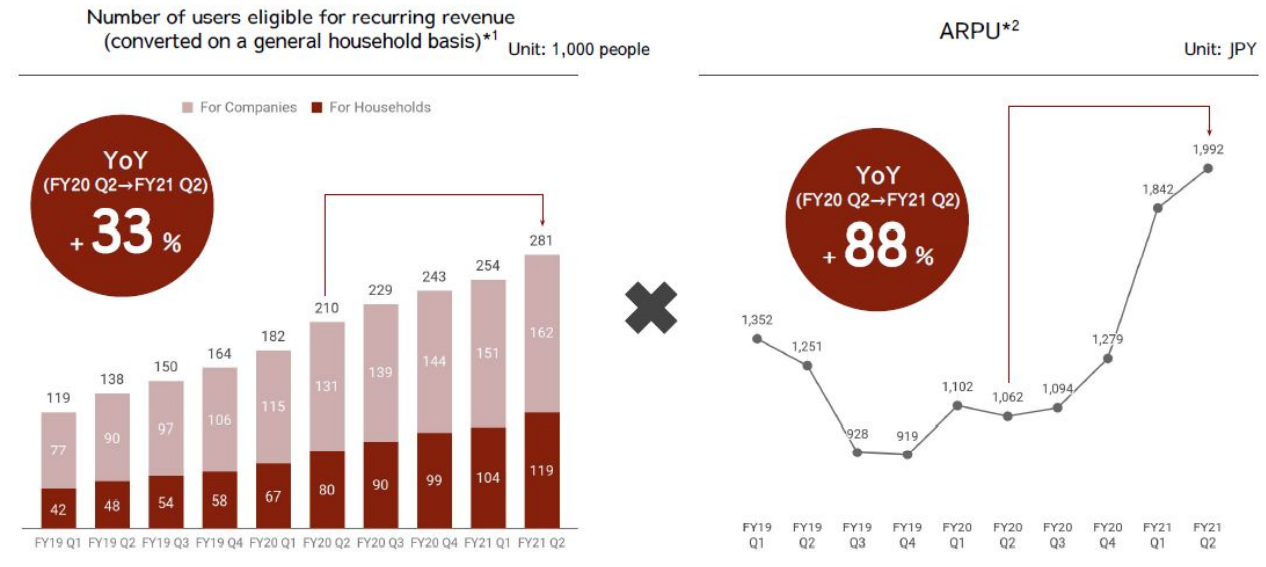
Users can choose the best electric/gas providers based on fee structures, power configurations and CO2 emissions. ENE receives one sign-up fee + monthly charges equaling to a fixed portion of monthly usage fees paid by consumers who switched electricity to suppliers with “ENECHANGE”. The company can offer the entire process (from comparison data offering till completion of switching) for free.
Thanks to an increase of partner entities, numbers of recurring sales customers and ARPU (Average Revenues Per User) increased 33% y/y and 88% y/y, respectively.
(Source: the Company’s earnings presentation for Q2 2021).
2. Data Business (Data Analysis)
The company aims to provide unique marketing data using experience it gains through dealing with customers in Platform business. Thus, ENE can support the several needs of energy companies (acquiring new customers, customer engagement, supply and demand planning).
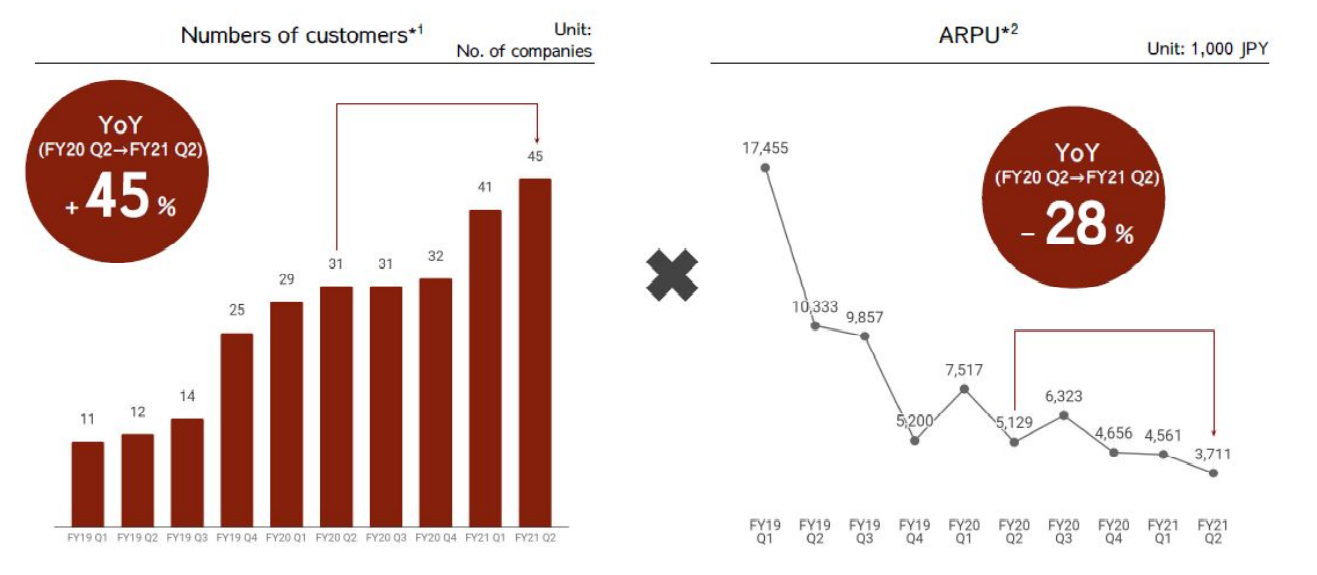
The company currently offers two energy marketing SaaS products * which helps ENE grow its DATA customers by 45% y/y as of Q2 21. ARPU decreased by 28% y/y due to an introduction of products with lower price points and new customer sign up. However, the company expects ARPU to again increase through cross selling and upselling. Management believes ARPU will improve as the company will expand into EV charging segments which are one of the main growth initiatives.
*Two energy marketing SaaS:
SMAP = Smart Meter Analytics Platform, is a service that uses a smart meter that digitally measures electric power and sends it as data. By analyzing the power data collected by smart meters, the company will be able to provide more relative services.
EMAP = Energy Marketing Acceleration Platform supports the marketing of the energy retail business by utilizing the know-how cultivated through the operation of Enechange platforms. Specifically, services include predicting power and gas consumption, comparing the plans of ENE with those of other companies, and analyzing user behavior.
(Source: The Company’s earnings presentation for Q2 2021).
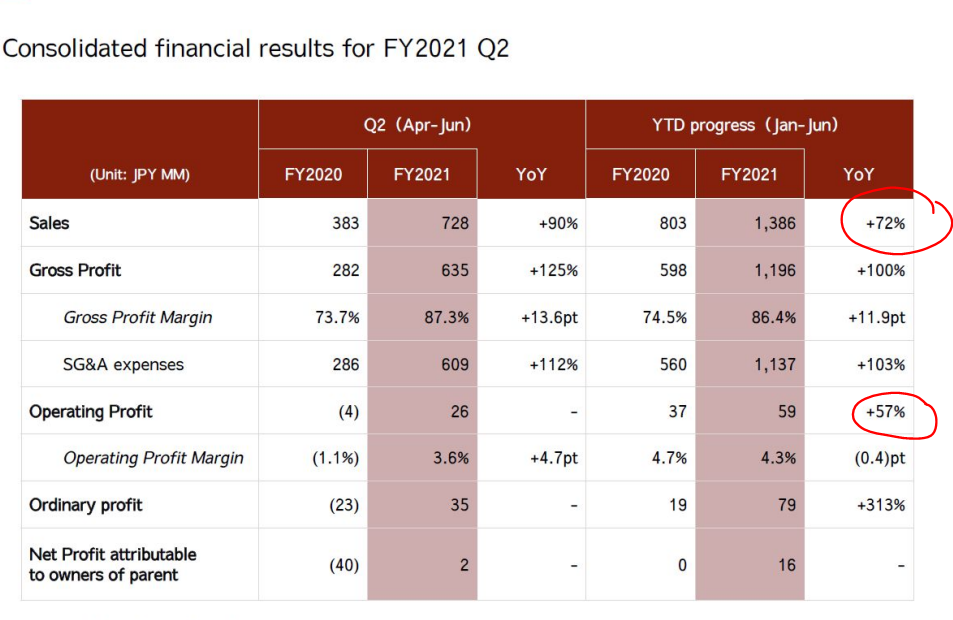
5. Financial Highlights
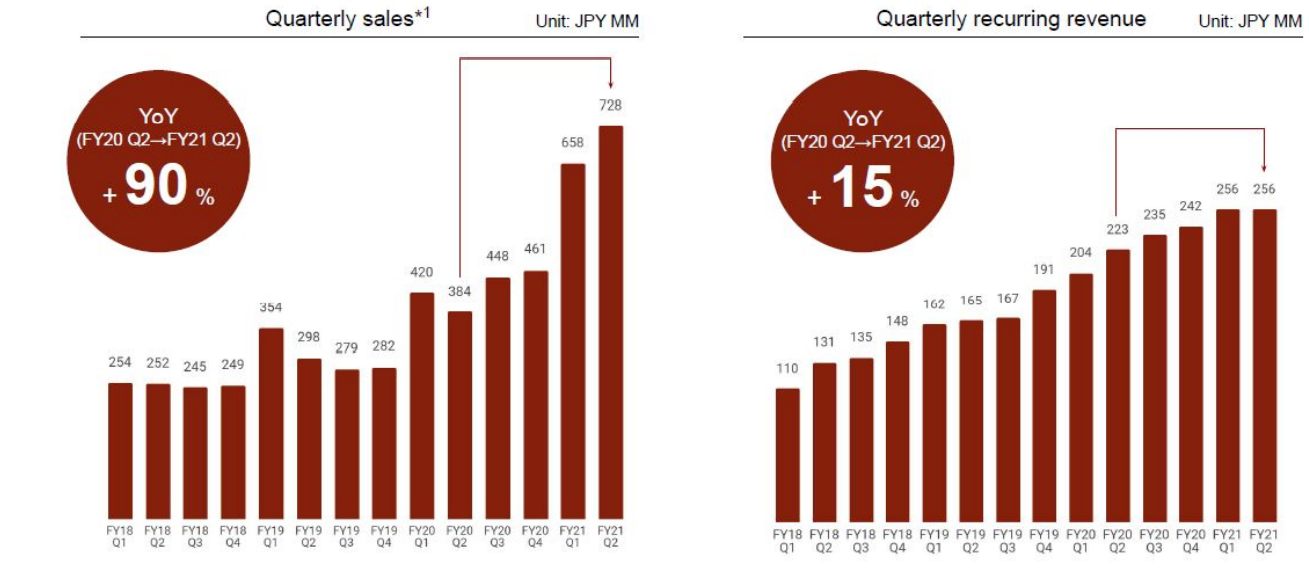
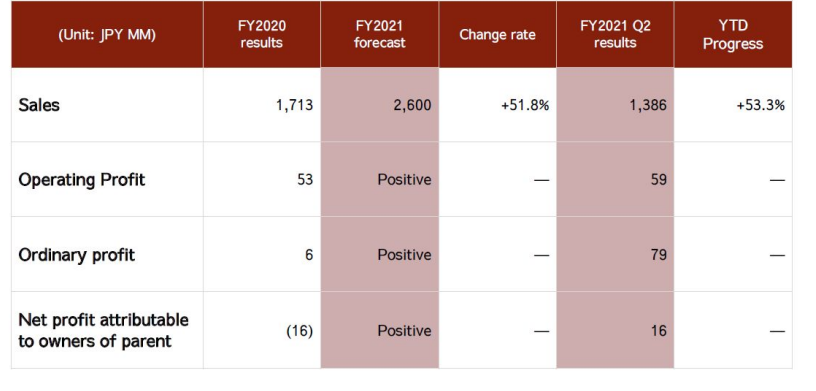
The below table highlights a steady Q2 and Jan through Jun/2021 growth in sales and operating income. In fact, Q2 sales was a record high for ENE and recurring sales increased 15% year on year shown in the bar graph.
(Source: The Company’s earnings presentation for Q2 2021).
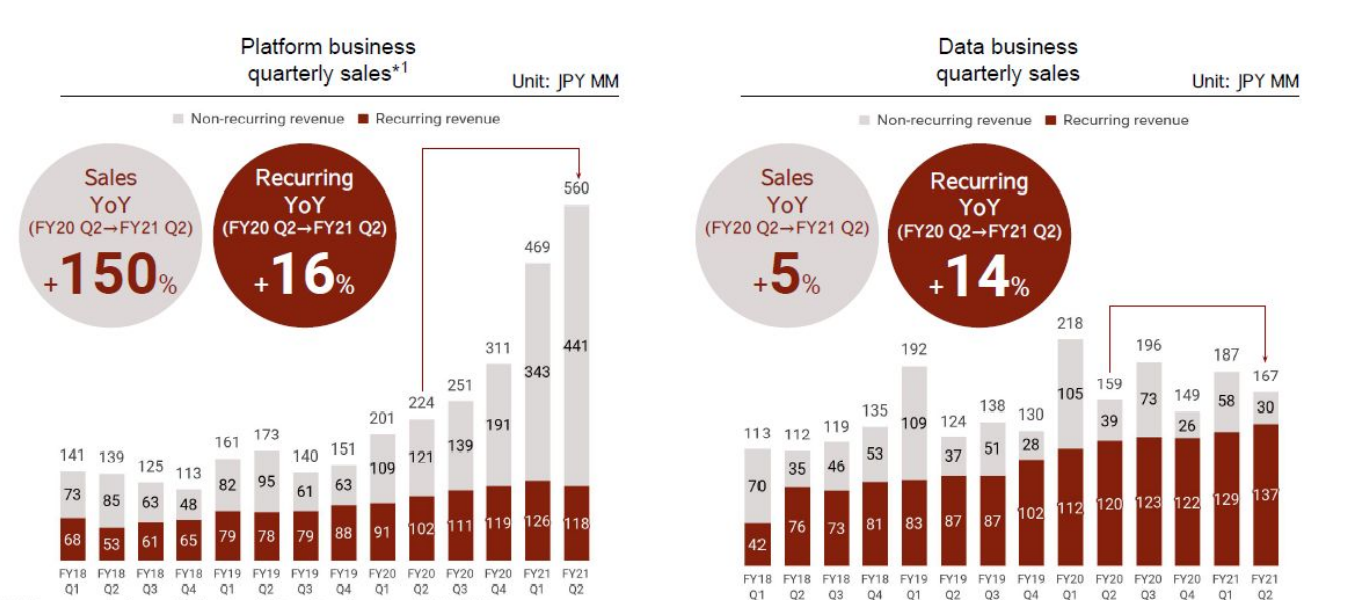
The following two bar graphs speak for the fact that Platform business still is the major sales driver, but Data should increase its contribution, as the company expands its offerings from EMAP/SMAP to DR/VPP segments. The planned launches of these new products are discussed in Investment Strengths/Growth Initiatives section.
(Source: The Company’s earnings presentation for Q2 2021).
As a company is on its initially growth acceleration stage, it prioritizes the growth at the expense of profitability i.e., willing to spend. Nonetheless, their expense trend is NOT outrageous. The below 2 graphs depict the trend of ENE’s promotion expenses. LTV/CAC (life time value of a customer/customer acquisition costs) stands at 4.9x as of Q2 21 vs. 3x/the presumed healthy level. The company plans on spending aggressively on promotions.
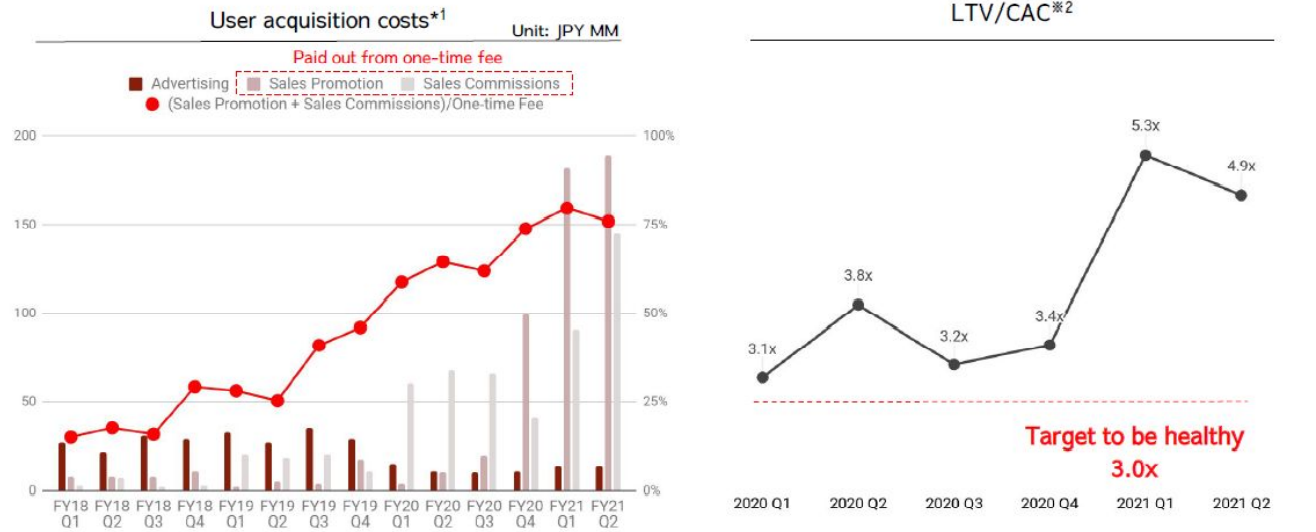
- Total advertisement expenses
- The customers’ lifetime value to customer acquisition costs.
(Source: The Company’s earnings presentation for Q2 2021).
Upward revision to FY 2021 sales forecast:
Driven by strong first 6 months results for 2021, the company revised from JPY 2.3Bn ($230 MM) to JPY 2.6bn ($260 MM) which translates to 52% increase from FY 2020 level.
6. Investment Strengths and Risk:
Strengths:
1. Japan’s leading Climate Tech stock, as vindicated by the following stats:
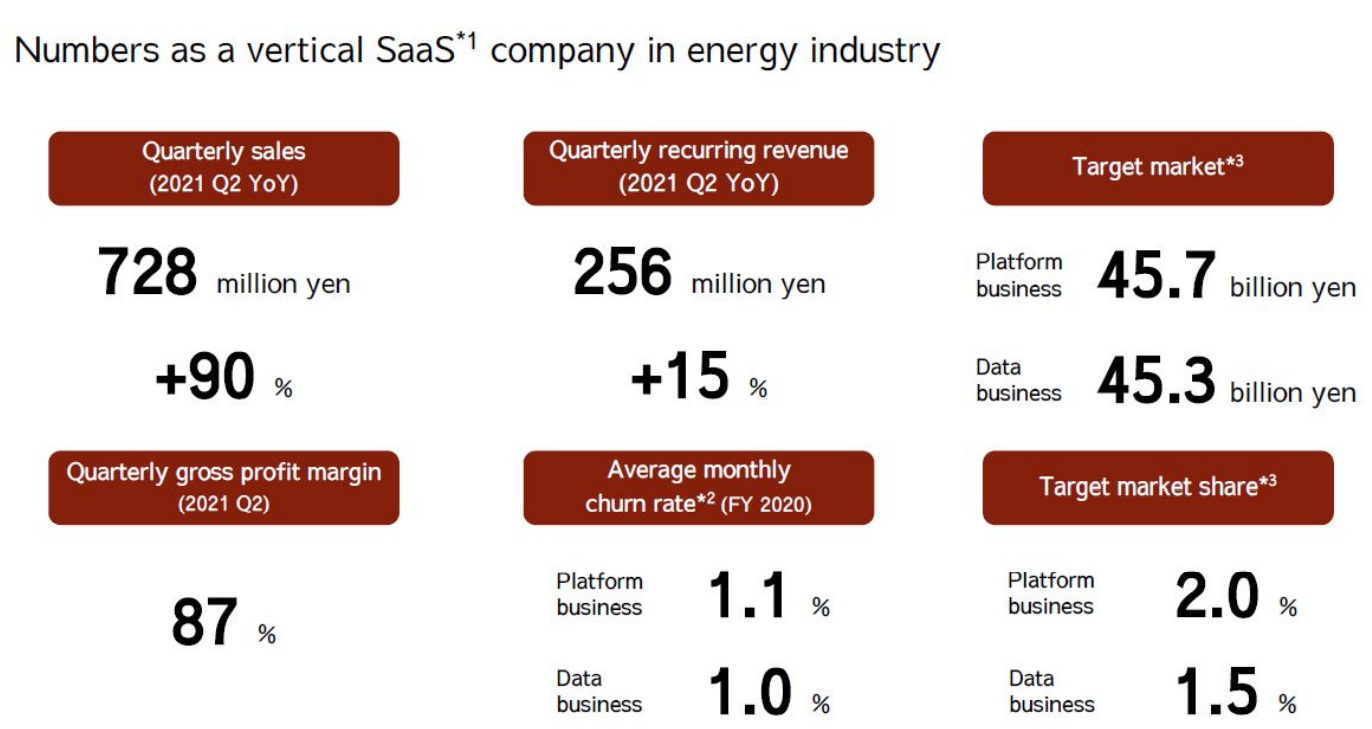
*1 Industry-specialized SaaS that provides functions specialized to each industry.
(Source: The Company’s earnings presentation for Q2 2021).
Clarifications on numbers of TAM (Total addressable markets) in the above table.
For platform business, TAM is based on total advertisement spending of utility industry. This is arguably a very big number which may not entirely be available for ENE. Nonetheless, the importance of on-line marketing has been well recognized by electric power providers ever since deregulation of electric utilities industry in 2015. The consumer’s willingness to switch their utility providers online is still not quantifiable. Yet, the platform which ENE provides to electric power providers is increasingly important to the eyes of power firms. Thus, we believe ENE’s addressable market is huge and provides ENE big growth opportunities.
TAM for Database business is based on new IT spending budgets of utility companies. Similarly, IT investment budgets cover overall technology system upgrades and maintenance. However, the majority of the incremental increase of IT budgets AFTER 2015 deregulation is likely dedicated to system enhancement to address deregulation related system enhancement which is the main market for ENE.
Again, huge market potential awaits the company.
2. Growth initiatives:
The company has identified and implemented several growth initiatives in the ever-evolving power industry. In Q2/21, the company participated in a project related to infrastructure for EV charging through a partnership with FreeWire, a US EV charging player. The other new product offering are highlighted below:
(Source: The Company’s earnings presentation for Q2 2021).
ENECHANGE DR: Demand response (DR) provides an opportunity for consumers to play a significant role in the operation of the electric grid by reducing or shifting their electricity usage during peak periods in response to time-based rates or other forms of financial incentives. Demand Response is used as a way to balance supply and demand (from website of Office of Electricity)
SMAP DR is Demand Response via a use of smart meters installed at households.
ENECHANGE KIWI: In Q1 21, ENE reached an exclusive operational and marketing sharing agreement with KIWI Power (owned by Engie in UK). KIWI Power is one of the largest VPP SaaS companies in the world. ENE plans to launch VPP SaaS “ENECHANGE KIWI” shortly.
Japan Energy Funds: In order to catch up with the technology leaders in US and Europe and to obtain marketing rights in Japan, ENE has created Japan Energy Capital Fund 1 and 2. These funds are supported by capital infusion from several investors and corporations, such as Looop, Daiwa Energy, Hokuriku Power, Nippon Unisys, and Toshiba Energy Systems.
Major investments from JEC Fund 1 includes Ambri Inc (focus on next generation EV battery storage, major investor: Bill Gates) and Sense Labs (a leader in smart meter data analysis). To obtain marketing rights in Japan.
3. Market Capitalization Expansion Potential;
Japan is still lagging behind US/UK in Energy 4D areas, which, in turn, presents the company room for growth. The below is the list of market cap of ENE’s foreign peers which I mentioned in the early part of this report. This light highlights the fact that EV charging forced companies are commanding high investor interests and market capitalization. The top of the list, Charge Point enjoys $7 bn market cap vs. ENE’s $550MM.
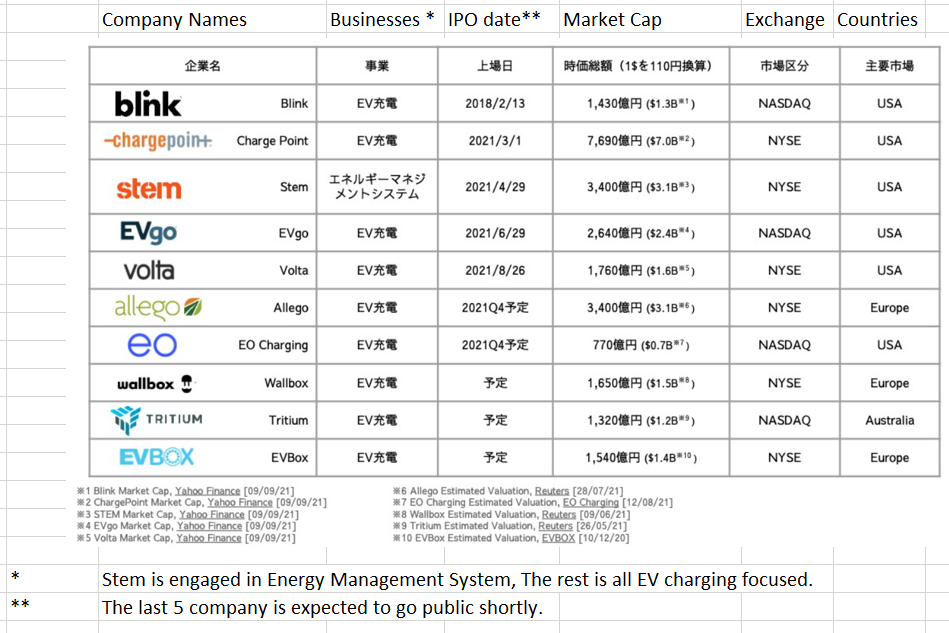
(source: investor presentation material as of 9/11/21 hosted by Logmee Finance)
Risks:
Major risk is the slowdown in online switching demand of end users/consumers which will affect ENE’s both platform and data businesses.
To mitigate, management has been aggressively entering new product areas and improving its knowledge base by teaming up with foreign peers who are further along on the growth path.
7 Near-term Selling Pressure:
As noted in useful tips section, when the stock’s outstanding margin buy volume is high and rising, that will function as the near-term selling pressure. For ENE, as the below table indicates that there is small number of margin sell volume. Margin buy volume is high and slightly rising. In fact, it’s even higher than one day trading volume (Noted as “Left over margin”). Therefore, we can assume that there are some shareholders, who bought shares on margin, hold ENE shares with unrealized losses currently. They are eager to sell the stocks as soon as losses turn to gains, creating near term selling pressure.
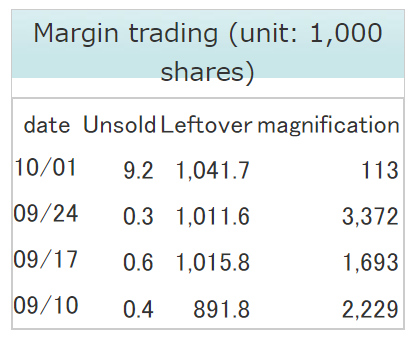
(Source: Kabutan.com)
[Disclaimer]The opinions expressed above should not be constructed as investment advice. This commentary is not tailored to specific investment objectives. Reliance on this information for the purpose of buying the securities to which this information relates may expose a person to significant risk. The information contained in this article is not intended to make any offer, inducement, invitation or commitment to purchase, subscribe to, provide or sell any securities, service or product or to provide any recommendations on which one should rely for financial securities, investment or other advice or to take any decision. Readers are encouraged to seek individual advice from their personal, financial, legal and other advisers before making any investment or financial decisions or purchasing any financial, securities or investment related service or product. Information provided, whether charts or any other statements regarding market, real estate or other financial information, is obtained from sources which we and our suppliers believe reliable, but we do not warrant or guarantee the timeliness or accuracy of this information. Nothing in this commentary should be interpreted to state or imply that past results are an indication of future performance