VisasQ (VQ or the company) is a leading ENS (expert network service)* provider in Japan with 120,000 advisors/consultants. They have 800 accounts. It is capable of locating a good match via a just 1 hour interview process. 70,000 matches have been made so far.
*What is ENS?
It is a service which connects knowledge users with industry experts (knowledge holders). ENS started around the end of 1990s in the US and often used by financial institutions, and consulting firms. Its application is various such as industry research, user research and business developments.
1. Investment thesis
1) Japan’s long standing problems can be “low hanging fruits” for foreign players
VQ often receive inquiries when 1) foreign companies want to enter Japanese markets and 2) foreign investors want to do research on Japanese stocks and specific industry trends.
The acquisitions of two fintech’s may be fresh in your memory:
1) PayPal bought Paidy – a buy now, pay later (BNPL) startup in Japan – for $2.7 billion last year (9/21)
2) KKR acquired Yayoi from Orix in 12/21. Yayoi has been Japan’s number one cloud accounting software for 6 consecutive years with over 2.5 million users. Yayoi is widely used by small to midsized entities.
These cases of acquisition of Japanese companies highlight growth opportunities which foreign players see in Japan by incorporating their advanced technologies.**
**The Japanese society is viewed as technologically advanced, but there are many areas where Japan is behind the digital curve, which brings substantial opportunities for US/European companies. Especially in the area of payments with almost 80% of transactions still made in cash, non-Japanese players see good growth potential, when and once their payment payments mechanism is incorporated into Japanese payment eco-system.
Many international companies are still reluctant to expand into Japan, being scared by the widely reported failures of large companies. For example, Vodafone failed in Japan since they assumed that the handsets which were popular in Europe would also be accepted in Japan with open arms. Vodafone was forced to admit that they didn’t do sufficient market research which might have told them that Japanese consumers’ tastes were often different.
In contrast, Dyson did a thorough market research and introduced more compact vacuums which were more suited for smaller homes in Japan.
VQ helps international companies in making sure that they would “understand” the difference in culture, languages and tastes of Japanese consumers who often require high standards.
2) Leveraging on Japanese companies’ need to go global
Japanese companies need to create new businesses and expand abroad to survive. VQ can help these companies in gaining overseas expertise. To further enhance their ability to match increasing numbers of Japanese entities which desire to gain knowledge of foreign markets, the company has concluded its acquisition of much bigger US ENS company, Coleman (Price tag: $102MM). This acquisition is the topic of the next bullet point.
3) Foray into North America/European ENS market
The rationale and details of Coleman Acquisition
Rationales
1. Onto the global stage
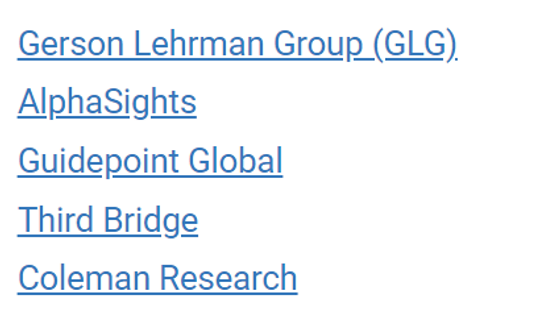
By acquiring Coleman, one of the 5 leading ENS firm, VQ will surpass many rivals to become the globally recognizable ENS firm which has been VQ’s main mission.
As the below graph highlights, global ENS markets have grown at CAGR (compound annual growth rate) of 17%. A solid rise in research on a global scale has supported an increase in ENS demand. This historical growth statistics is in line with industry expectations we will discuss in section.
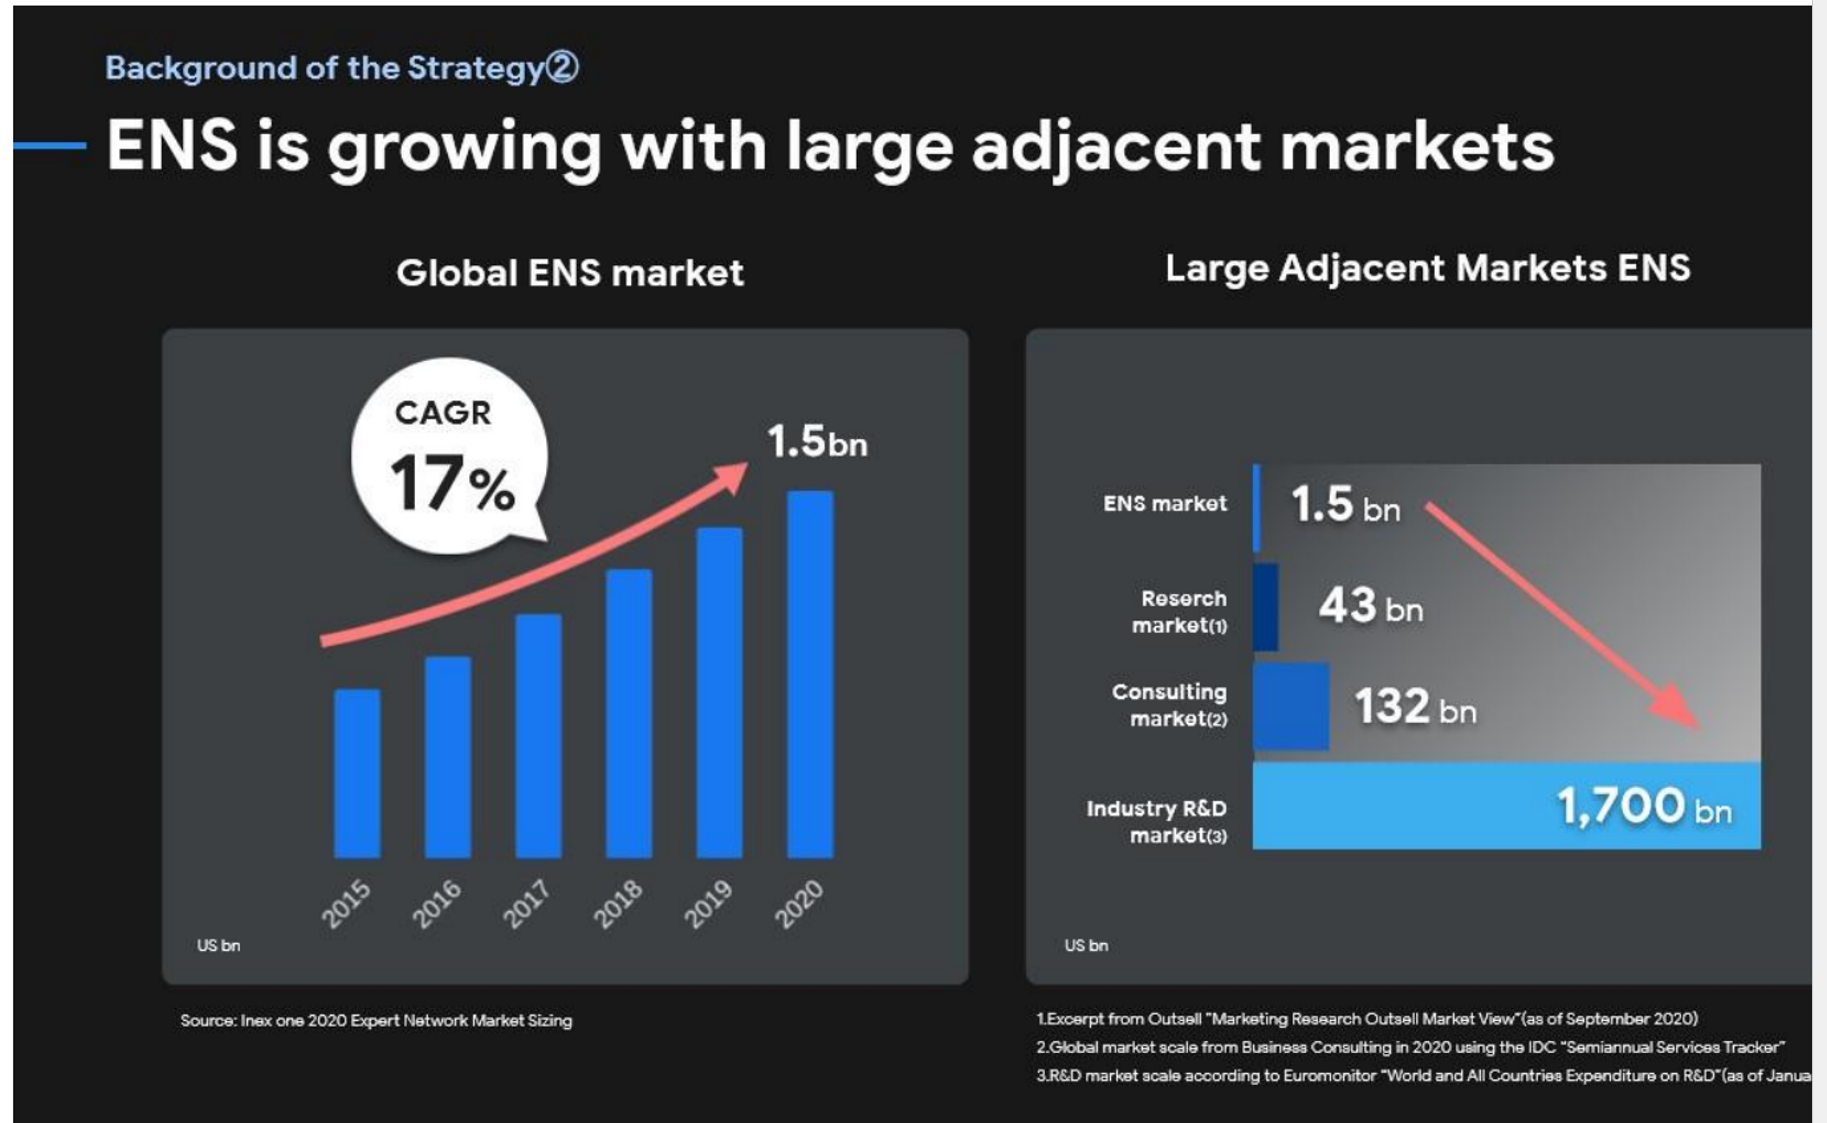
(Source: Q2 Financial Results Briefing for the Fiscal Year Ending February 2021)
2. From a Foe to a Friend
VQ has not publicly cited this as one of the acquisition reasons, so this is my personal opinion. I believe that VQ has just absorbed one of the formidable foes. Coleman is listed as global top 5 by the article: Expert Network Industry Nears $2 Billion by Sanford Bragg, dated 11/8/21 posted on Integrity Research Associates site
3. Coleman’s strengths abound: It is (was)
1) established in 2003 as a very early player
2) a leader in the North America which accounts for 50% of global ENS market
3) boasts 300+ clients comprised of the world’s largest HFs, mutual funds, PEs, consultancies and corporations
3) 260,000 registered experts with focus on highly sought-after IT industries and experiences as executives.
4) global reach with 200 employees located in 5 locations (New York, Releigh, Los Angeles, Hong Kong and London)
Having a Coleman’s large North American expert data base expands VQ’s global reach quickly. The below charts highlights the benefits of VQ/Coleman teamwork.
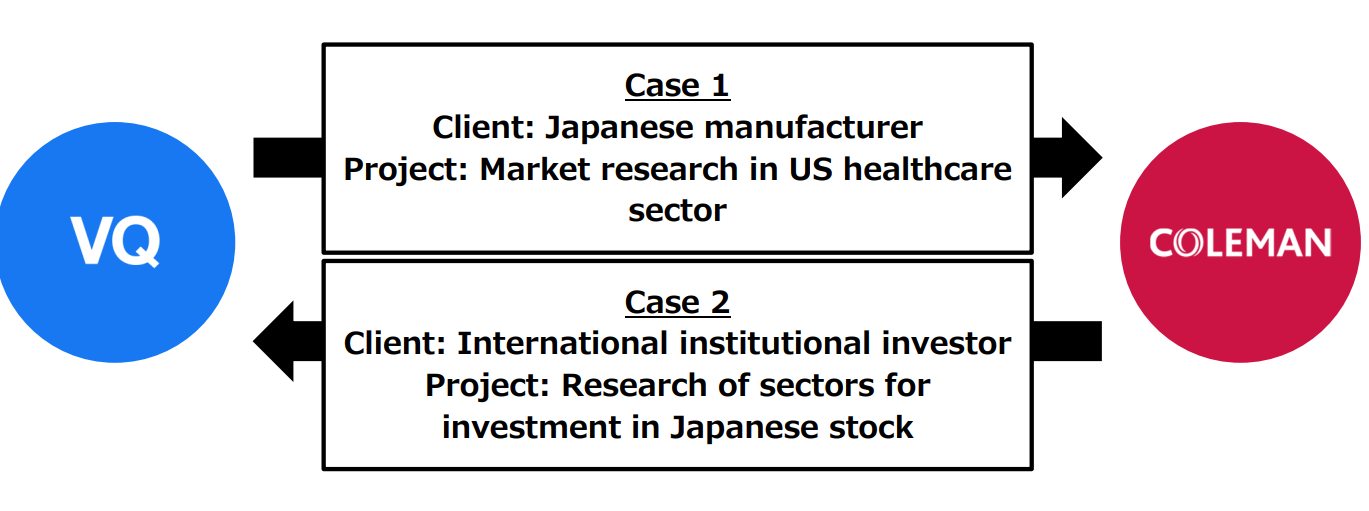
(Source: Web briefing on Acquisition of Coleman Research Group, Inc.)
How was the purchase financed?
VQ has financed the deal with a combination of debt and equity. It has issued JPY 7.5 Bn ($68 MM) of preferred shares to a private equity fund operated by IXGS Inc. The company obtained JPY 4 Bn loan from Mizuho Bank. Coleman Research’s existing shareholders and management will also buy JPY 1.4 Bn of the stock. The new stock issuance (A&B shares)will result in a 33% dilution when the shares convert to common stock at JPY3,724.
Goodwill impacts:
As of 11/1/21 (The official closing date of the acquisition), the company estimated goodwill amounts of approximately JPY 10 Bn ($100 MM) which will be amortized over 10-15 years at JPY 670MM-JPY 1Bn/year. This amounts can be adjusted as auditors are still in the process of finalizing the amounts of intangible assets.
Management has guided that EBITDA for FYE 2/22 (thus before goodwill amortization) to be JPY 1,400 MM. This will leave operating income of JPY 400-730MM.
I am not planning to be engaged in a discussion on an acquisition price. Coleman is a profitable industry leader in an arguably most important ENS market (i.e., US). We should focus on growth potential of sales and profits of the combined entity.
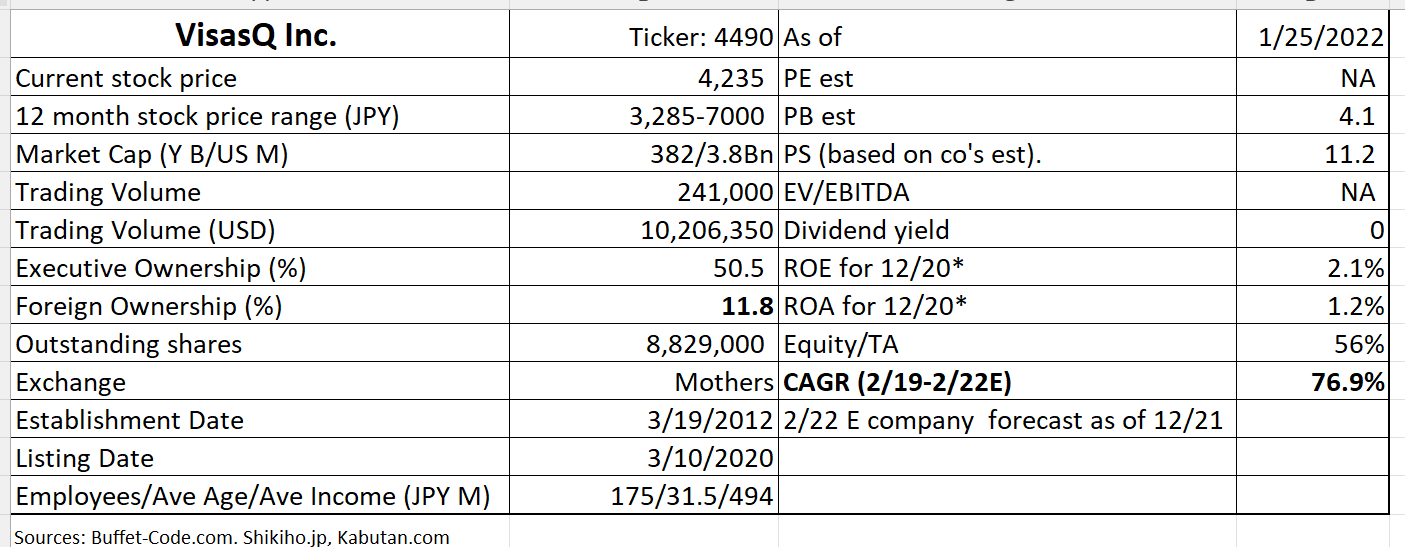
2. Technically Speaking

(Source: Buffet-Code.com)
The stock popped upon Coleman acquisition in the Summer and took an upward move till November. After that, the stock has come down, due partly to the general market weakness and profit takings. The above chart shows that the stock is currently trading at JPY 4,700 which is the largest volume cluster. The next resistance level is around JPY 5,600.
3. Business Model – VQ stand alone
There are two main products: 1) VQ core services which are supported by VQ staff and 2) VQ Lite.
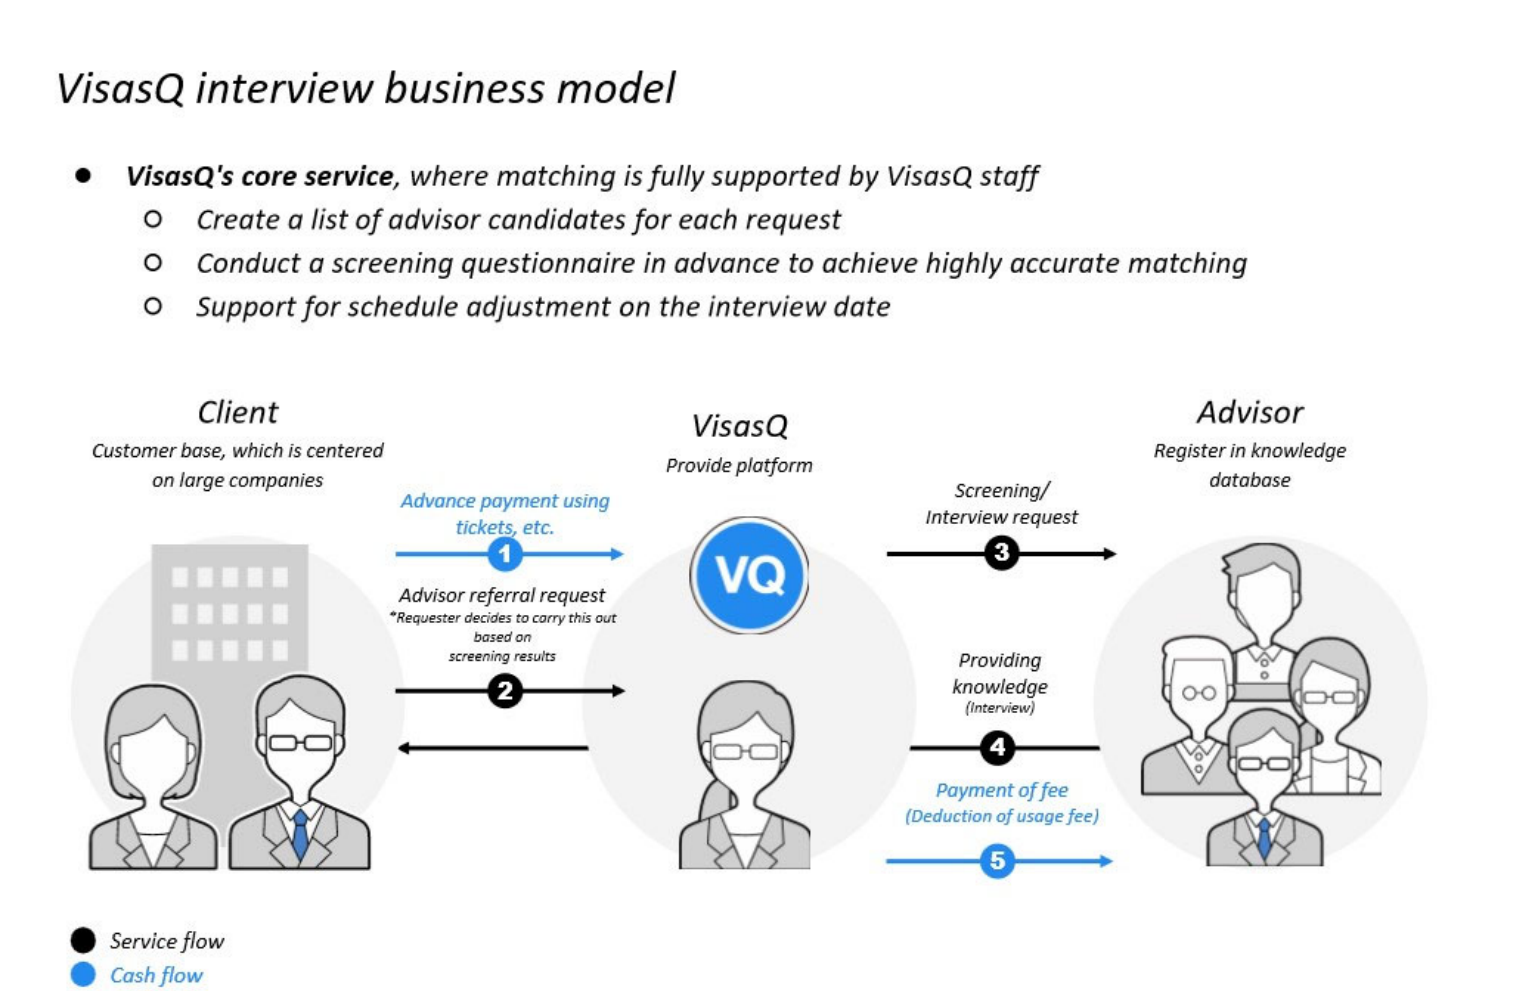
(Source: Q2 Financial Results Briefing for the Fiscal Year Ending February 2021)
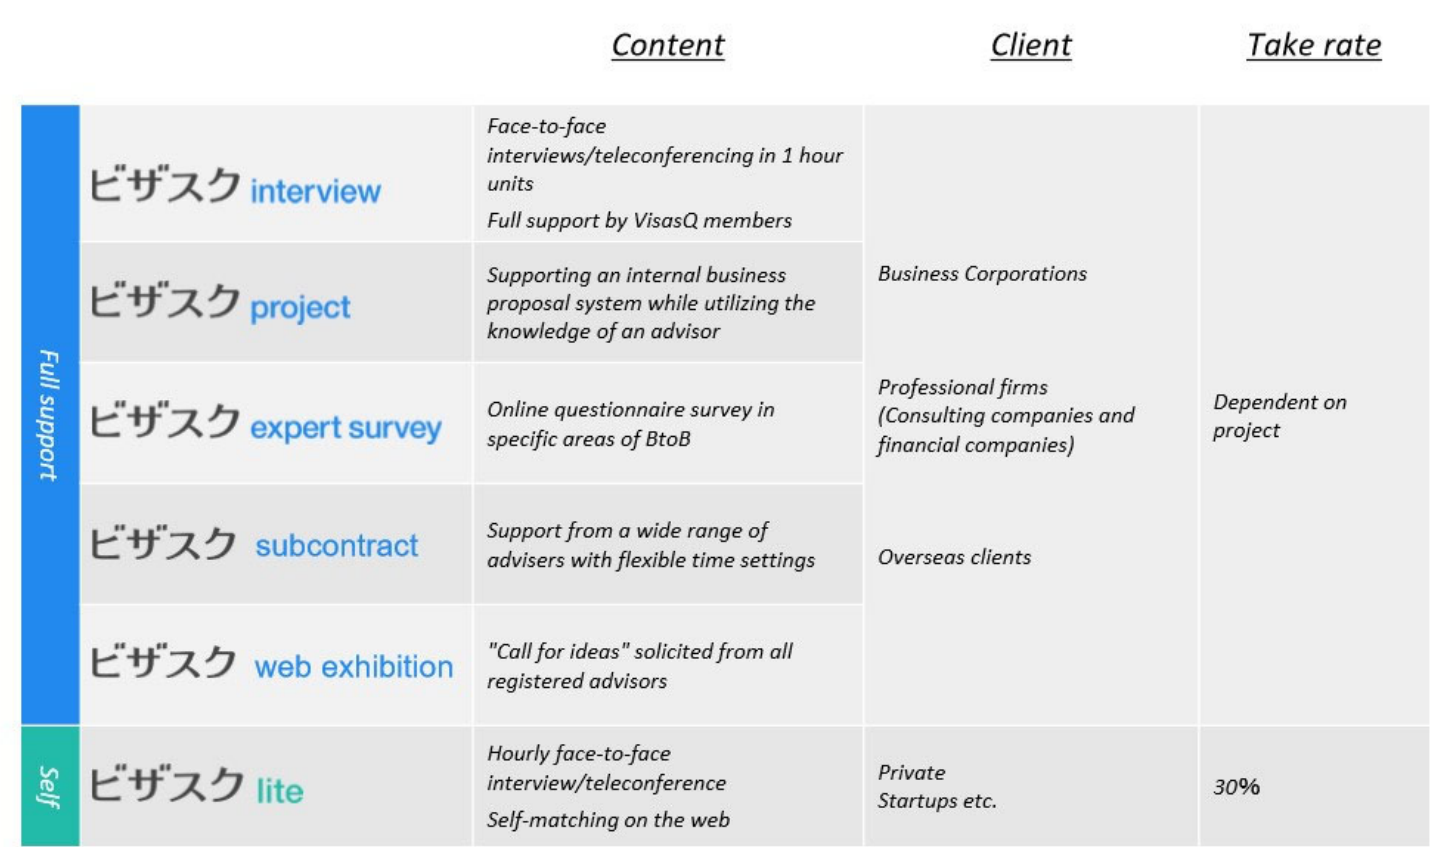
(Source: Q2 Financial Results Briefing for the Fiscal Year Ending February 2021)
Note: Take Rate=operating revenue ratio (transaction value/operating revenues).
1. Full VQ take rate varies.
2. VQ Lite (a marketing place on the web)
The user base of VQ Lite is different from full VQ’s, as the Lite is popular among local SMEs (small to mid-entities) and fast growing venture. Thus, cannibalization with Full VQ is limited. Take rate for Lite is set at 30% thus, as % of Lite grows, the company-wide take rate will come down (see also Financial Highlights section).
4. Financial Highlights
(Note: Coleman’s income statement will not be consolidated till Q4 results. However, Its balance sheet is consolidated in the group’s Q3 results).
Quarterly results trend:
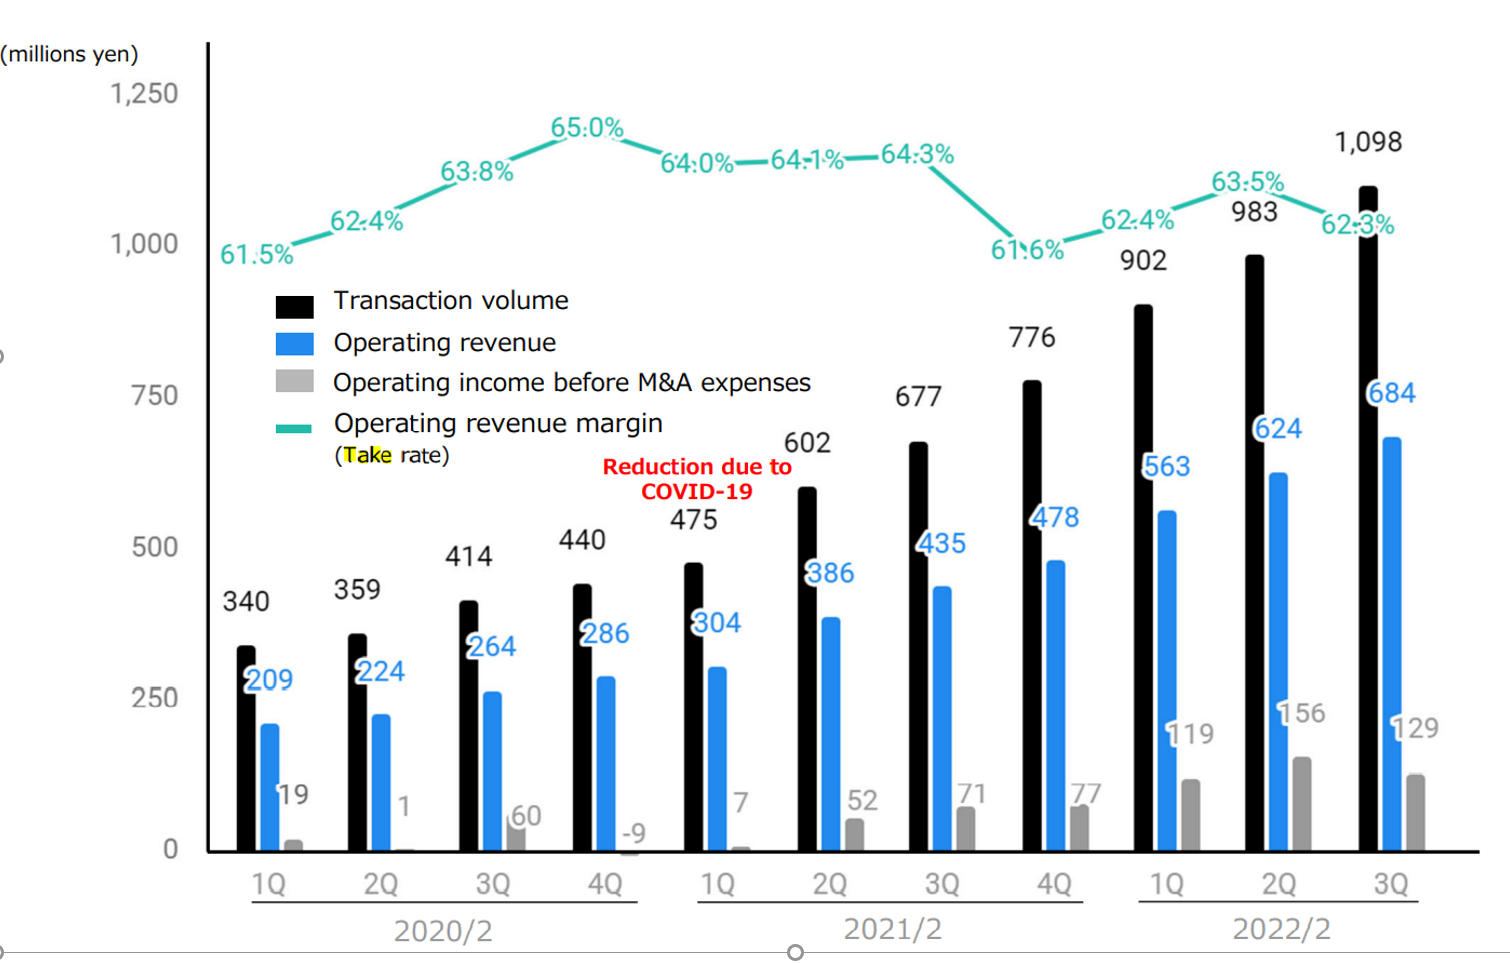
Transaction volume and operating income have exhibited a steady growth. Operating revenue margin (take rate) fluctuates, albeit staying at high levels, due to a shift in VQ product mix.
First 9 months of FYE 2/22 vs. 9 months of FYE 2/21
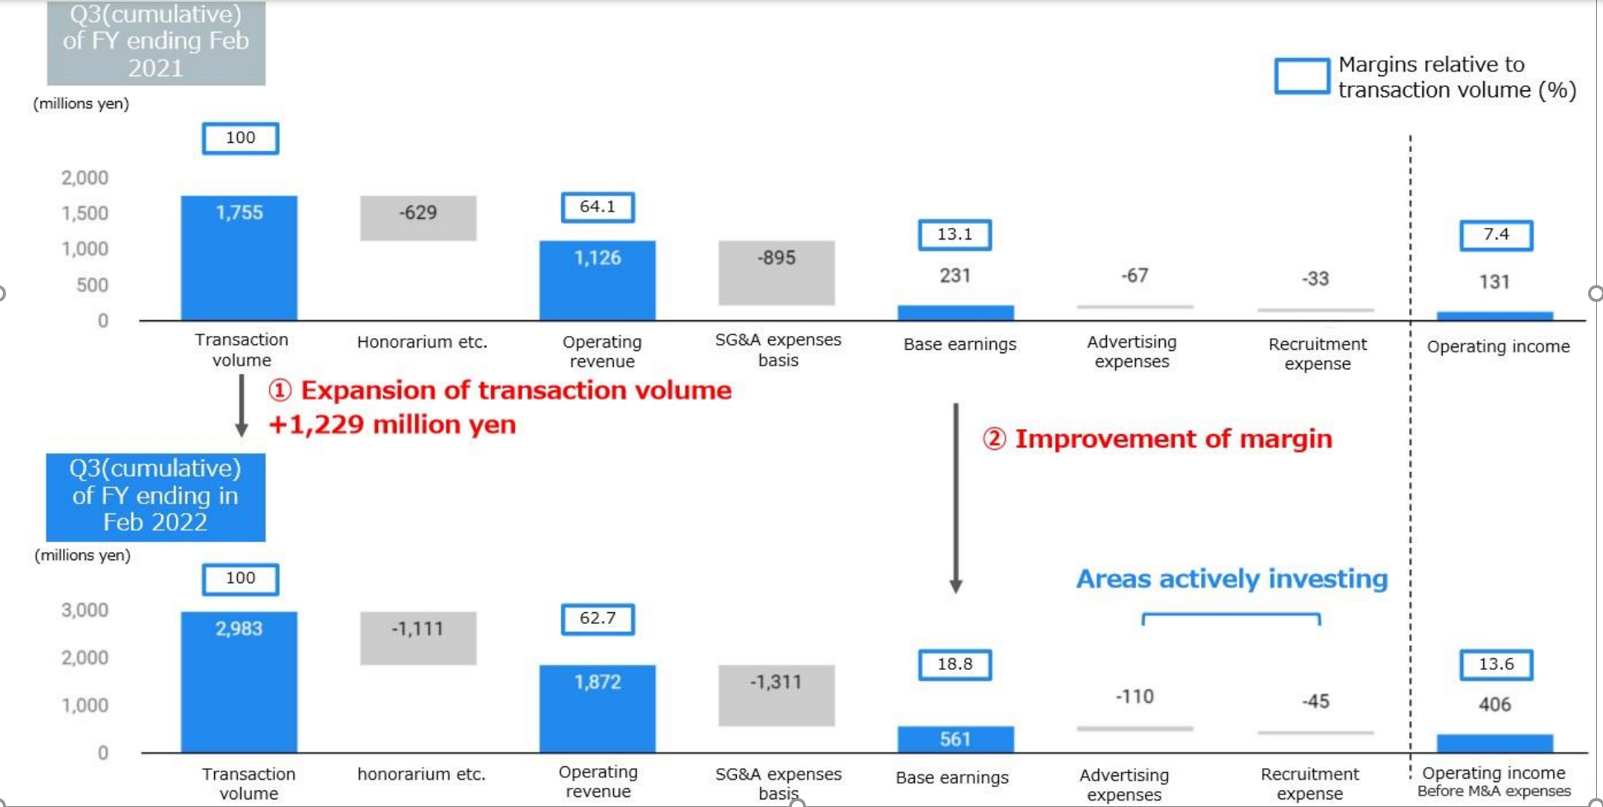
At this point, timing of synergies resulting from marriage of two companies is unknown. However, I would like to point out the margin improvement VQ saw in Q3 for FYE 2/22. The below chart describes VQ’s ability to control expenses. While operating revenue ratio (transaction value/operating revenues) went down from 62.7% in Q3/22 from 64.1% in Q3 for FYE 2/21, operating margin improved from 7.4% in Q3/21 to 13.6% in Q3/22. As mentioned earlier, the company wide operating revenues ratio went down since the ratio of VQ Light accounts with take rate of 30%.
Further, Coleman has been enjoying improving profitability as well. Thus, the combined companies should be able to report solid results.
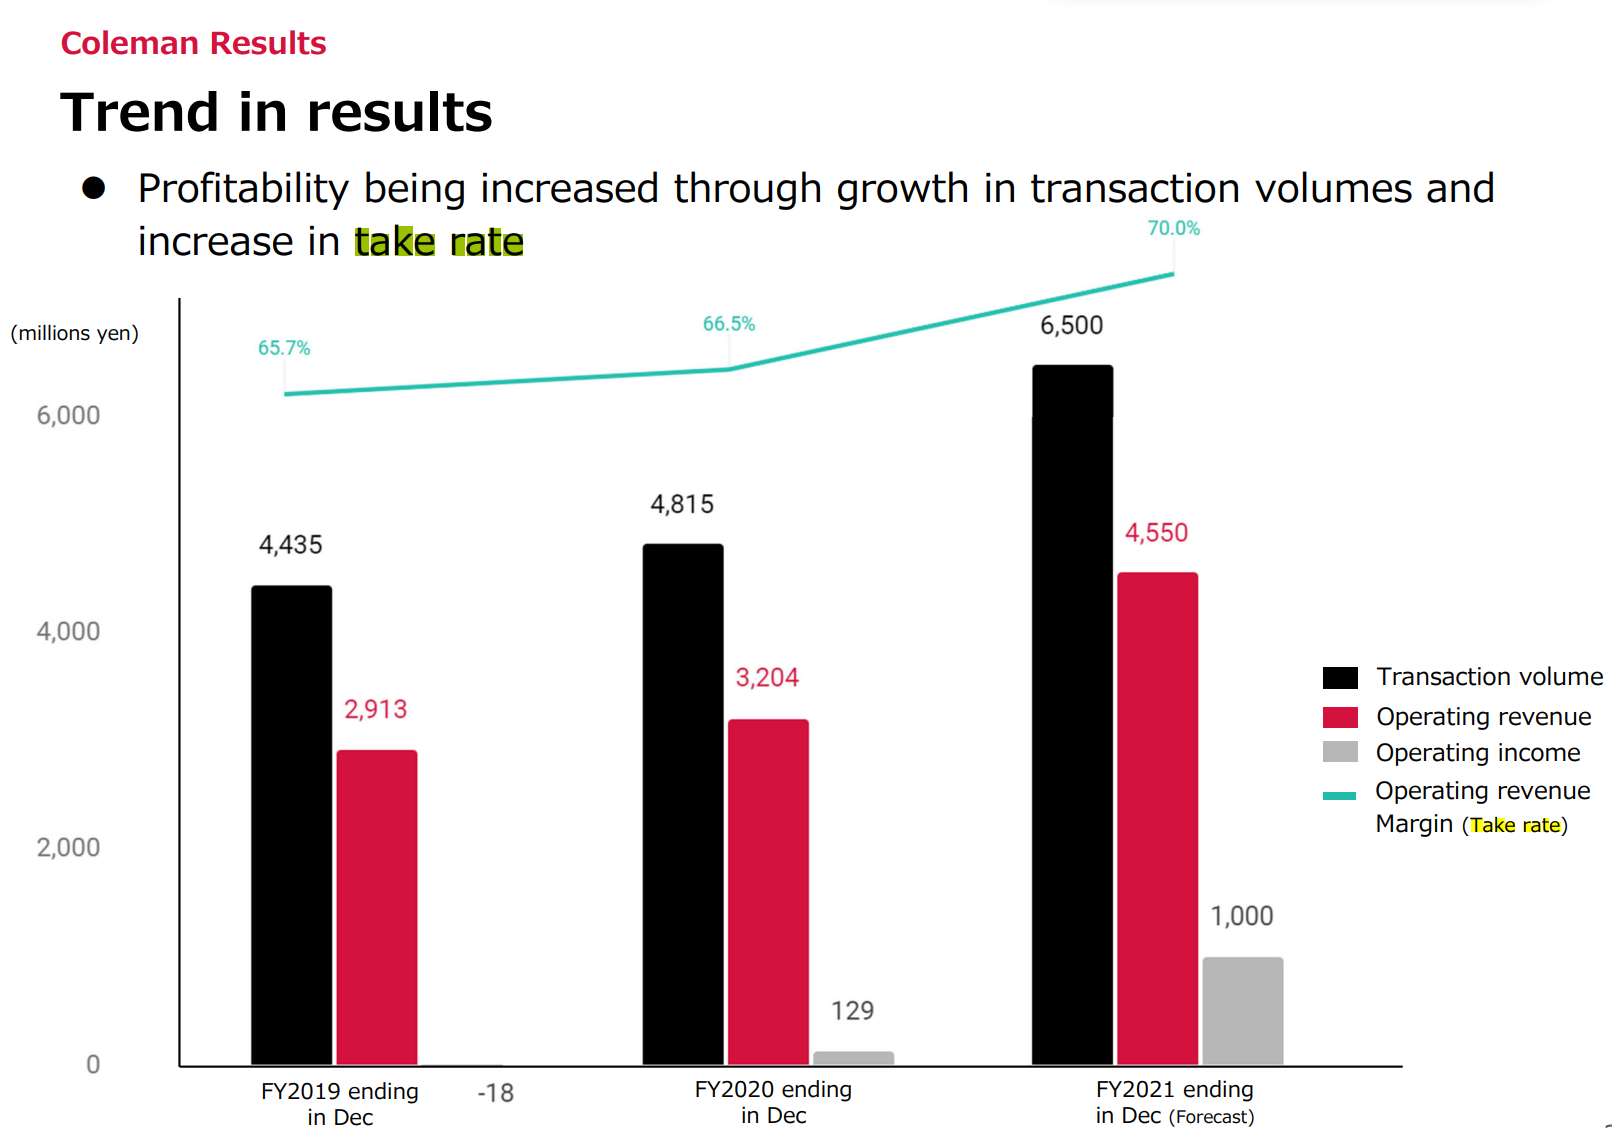
Reference: Coleman results for the past three year
5. TAM (Total accessible markets)
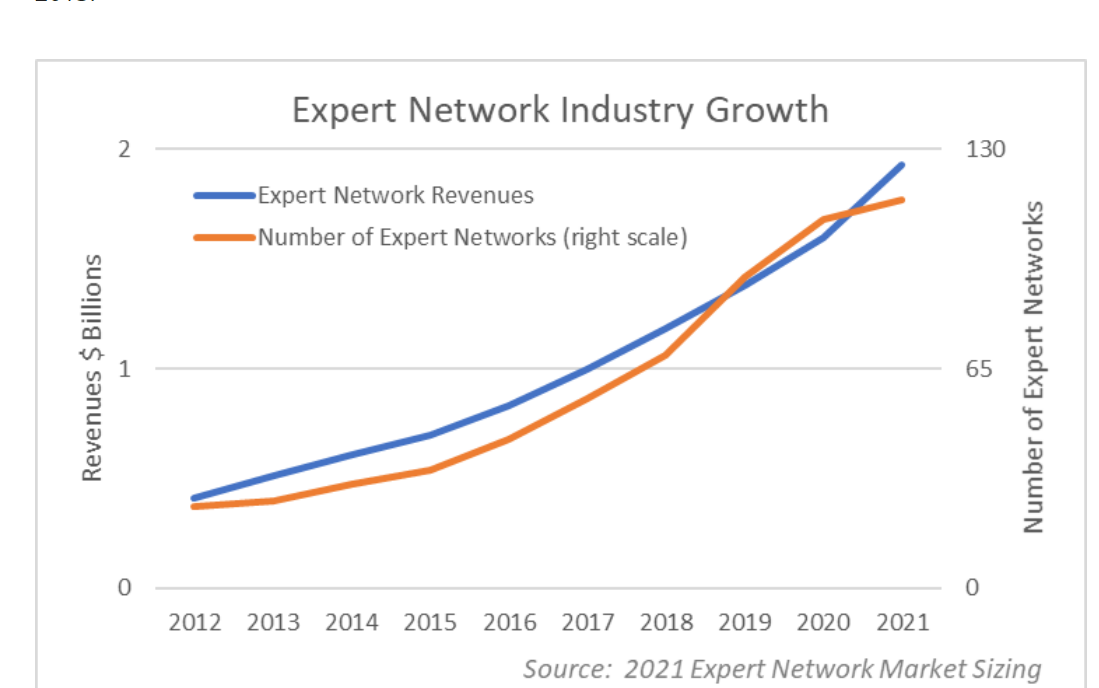
(Source: Expert Network Industry Nears $2 Billion by Sanford Bragg, dated 11/8/21 posted on Integrity Research Associates site)
2021 analysis released by Integrity Research and Inex One estimated that expert networks have grown their revenues over 20% in 2020 (cited by the 2021 Expert Network Market Sizing). The same 2021 Market Sizing also reported that industry revenues increased 21% to $1.92 Bn.
The below graph showcases the key performance indictor – the job openings of the largest 15 networks- has been upward trending over the recent months. This bodes well for the future industry growth. 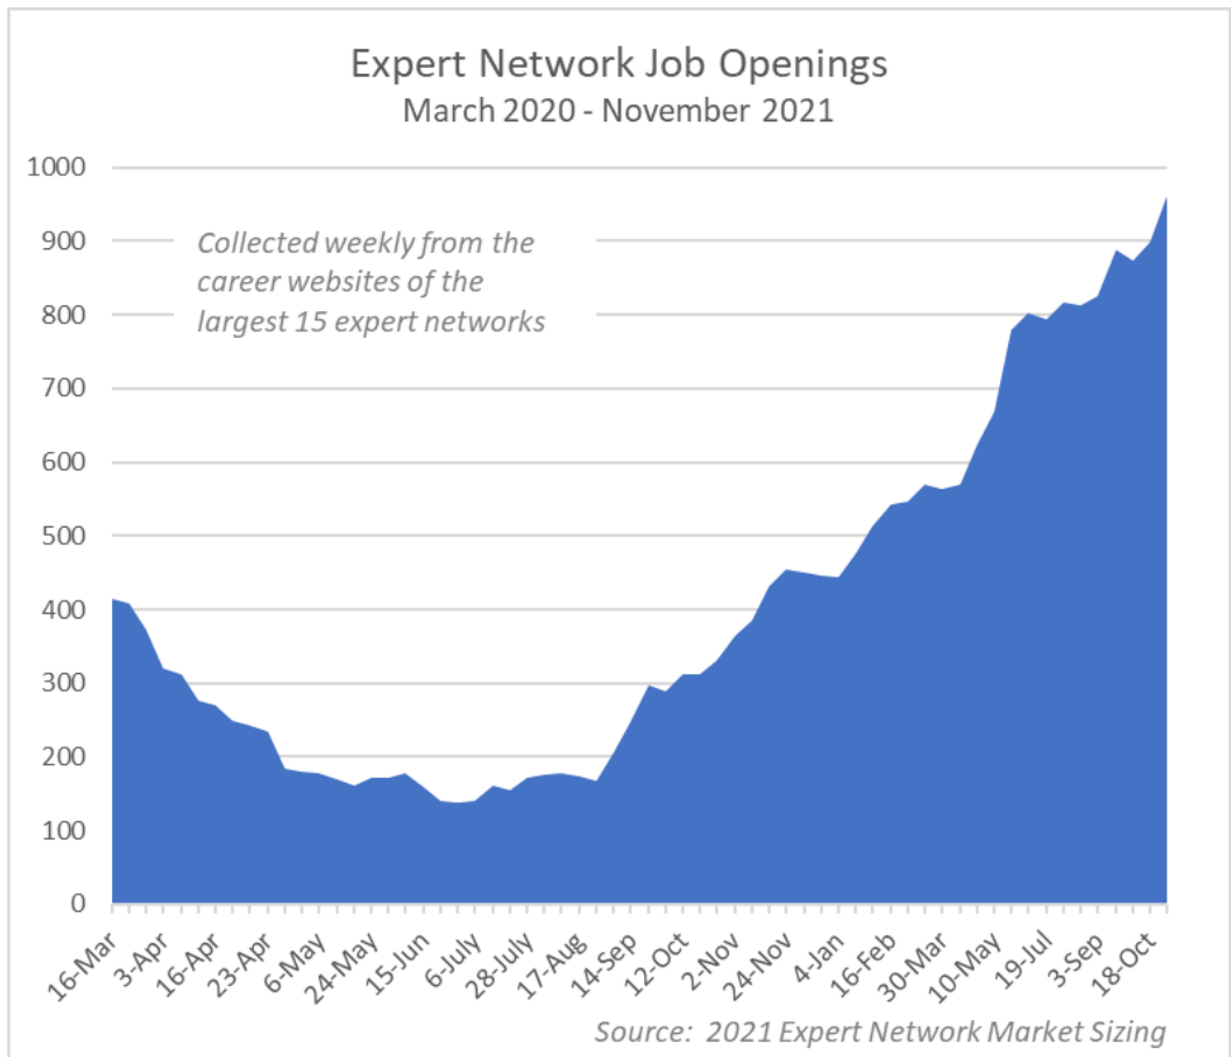
6. Strengths and Weaknesses
Strengths
1. The merger of two companies with different competitive edges
VQ’s competitive advantage is that they have a direct tie with operating companies, not just financial institutions/consulting firms who tend to be main users of ENS (see the pie chart below)
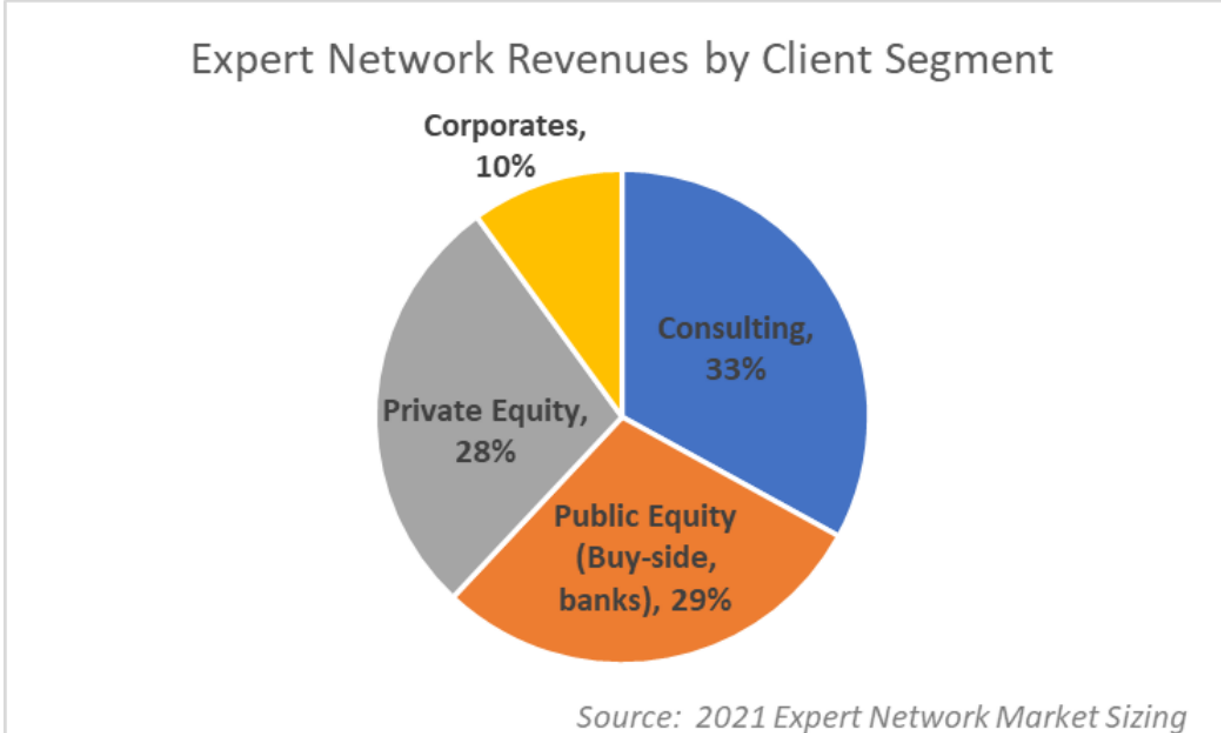
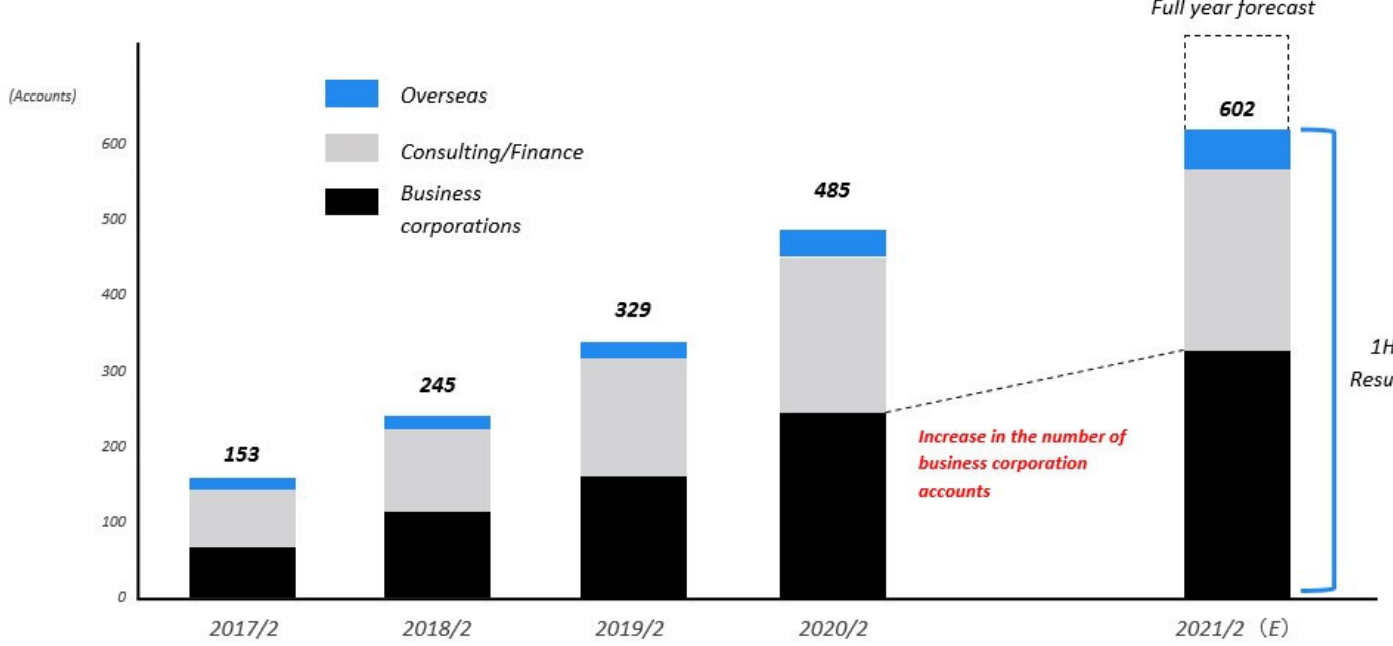
The below bar chart show that business corporation accounts are rapidly rising for VQ thanks to the launch of direct marketing and M&A advisory tool in the 2nd half of 2020. In fact, the half of VQ’s clients is corporations, compared to 10% with global ENSs. This enhances the benefits of merging with Coleman who has strengths on consulting market.
2. Industry Tailwind
As we have just witnessed, continued growth can be expected for global ENS industry.
3. Synergy
VQ has over 120,000 advisors in Japan, but there are only 20,000 overseas. With 260,000 registered experts, Coleman can fill this void. As we have seen earlier, the global ENS industry has been growing at 17% for the past 5 years, with the strong growth fueled by the solid growth of consulting industry. Coleman’s strategy has been to focus on the consulting market. Thus, the combined firm can address two client types: business corporations (VQ) and consultants (Coleman).
Weakness
1. Consolidation risk
VQ has just concluded the acquisition by which it absorbed 3x larger company. Management’s ability to successfully integrate two companies’ infrastructure is not proven yet. A mitigant, I believe, is the fact that the companies’ core assets are expert networks and matching technology.
VQ is behind Coleman in automating the matching process of experts and users, but is making progress in streamlining the process of proposing experts using past projects. Coleman can provide a smooth UI for the experts and clients. VQ management states that they want to learn from Coleman’s matching system.
In another words, VQ does not have a competing matching system which requires a complex conversion. Also, the companies have expert data base in different locations, thus, which may reduce a lengthy consolidation process.
2. Dilution Risk
As stated above, to finance the Coleman deal, It has issued JPY 7.5 Bn ($68 MM) of preferred shares to a private equity fund operated by IXGS Inc. Coleman Research’s existing shareholders and management will also buy JPY 1.4 Bn of the stock. The new stock issuance will result in a 33% dilution when the shares convert to common stock at JPY3,724. As per VQ IR, conversion will happen after 5/22. This is known to the investors, but the stock may still go down when actual conversion is executed.
7. Near-term Selling Pressure
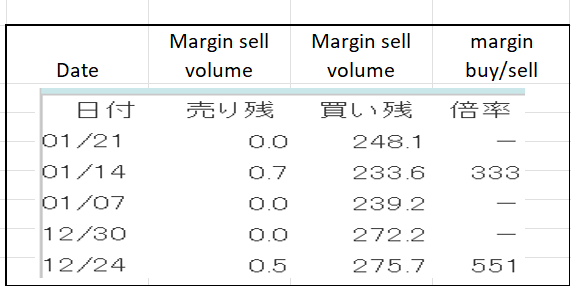
As noted in useful tips section of www.JapaneesIPO.com, when the stock’s outstanding margin buy volume is high and rising, that will function as the near-term selling pressure. For VQ, margin sell is almost non-existent and margin buy balance is large but gradually declining. Also, the current margin buy balance can be viewed as “acceptable” given it roughly equals to one day trading volume.
Margin trading unit (1,000):
(Source: Kabutan.com)
[Disclaimer]
The opinions expressed above should not be constructed as investment advice. This commentary is not tailored to specific investment objectives. Reliance on this information for the purpose of buying the securities to which this information relates may expose a person to significant risk. The information contained in this article is not intended to make any offer, inducement, invitation or commitment to purchase, subscribe to, provide or sell any securities, service or product or to provide any recommendations on which one should rely for financial securities, investment or other advice or to take any decision. Readers are encouraged to seek individual advice from their personal, financial, legal and other advisers before making any investment or financial decisions or purchasing any financial, securities or investment related service or product. Information provided, whether charts or any other statements regarding market, real estate or other financial information, is obtained from sources which we and our suppliers believe reliable, but we do not warrant or guarantee the timeliness or accuracy of this information. Nothing in this commentary should be interpreted to state or imply that past results are an indication of future performance
